CMOs: Use AI Dashboards for Marketing to Turn Citations into Revenue Signals
CMO playbook for AI dashboards: start on Perplexity, track Recommendation Share and voice share, then turn citation gaps into fixes.
· 15 min read

An AI visibility dashboard has to show three numbers: share of voice, citation rate, and Recommendation Share, broken out by engine. Engine coverage is what separates a real dashboard from a vanity report, so start narrow. Run a baseline of 20 to 50 prompts on Perplexity before expanding anywhere else. Our playbooks, including guidance from analyst Geraldine, walk through the buildout in more depth below.
TL;DR:
- Start measuring with Perplexity to obtain reliable citation data before expanding to Claude and Gemini, and only briefly include ChatGPT due to measurement fragility.
- Focus on Recommendation Share as the primary KPI, since it directly correlates with how often your brand is actively recommended in high-intent prompts.
- Build a normalized, disambiguated pipeline that logs raw data before processing to handle API changes and ensure long-term data consistency across engines.
- Prioritize discipline in early rollout by maintaining a stable prompt set and assigning clear ownership to data quality, avoiding scattershot engine coverage in the initial phase.
- Use a simple, layered dashboard with key metrics at the top and detailed diagnostics accessible through filters to support quick decision-making and targeted fixes.
Table of Contents
- What Is an AI Dashboard for Marketing, and What Should It Include?
- What Metrics Actually Matter on an AI Visibility Dashboard?
- Which AI Engines Should You Measure First?
- How Do You Build the AI Visibility Measurement Pipeline?
- How Do You Turn Dashboard Data into Prioritized Work?
- What's a Realistic 90-Day Rollout Plan?
- What Do Successful AI Dashboard Rollouts Look Like in Practice?
- How Should You Evaluate an AI Dashboard Vendor?
- What Should the Dashboard Interface Actually Look Like?
- What Are the Biggest Data Quality Problems in AI Visibility Tracking?
- What Privacy and Security Issues Come Up with AI Marketing Data?
- Why Presence Beats Rank in the AI Visibility Conversation
- Turn Dashboard Signals into a Monthly Executive Report
- Sources
- FAQ
What Is an AI Dashboard for Marketing, and What Should It Include?
An AI visibility dashboard for marketing tracks how AI assistants like ChatGPT, Gemini, Claude, and Perplexity mention, cite, and recommend your brand when buyers ask them for advice. That's a different animal from the marketing analytics dashboards most teams already run, the ones pulling ad spend and conversion data into charts. This is about presence inside a conversation you don't control, measured at the moment an AI model decides who to name.
A dashboard worth building or buying needs three structural pieces.
- Per-engine panels. Each engine gets its own view: share of voice, the actual citation links pulled into the answer, the top prompts driving mentions, and a coverage heatmap showing which query types you're winning or missing.
- A normalization layer. Brand names get mangled, abbreviated, or confused with competitors across engines, so the system needs disambiguation logic before it aggregates anything into a single number.
- Workflow integration. Rows need to connect to campaign tags, content briefs, and alerting so a sudden drop in citations triggers a ticket, not a shrug three weeks later.
HubSpot's framing of AI visibility centers on exactly this: a stable prompt set submitted to each engine, aggregated into share-of-voice and citation data, then routed back into content production. Skip the workflow connection and you've built a report nobody acts on.
What Metrics Actually Matter on an AI Visibility Dashboard?
Mention rate and citation rate sound like the same thing. They aren't, and confusing them is the fastest way to misread a dashboard.
- Mention rate counts how often your brand name shows up anywhere in an AI-generated answer, including passing references with no link back to you.
- Citation rate counts how often the model links to your actual domain as a source. This is the more actionable number because a citation is traceable to a page you can fix, optimize, or expand.
- Recommendation Share measures the percentage of high-intent buying prompts where your brand gets actively recommended, not just mentioned. Atomfoundry describes it as the AI-era equivalent of search market share, and it's the metric with the most direct line to revenue.
- Recommendation Position tracks where in the answer you land, first-named, buried in a list of five, or offered as an alternative after a competitor.
- Prompt coverage shows what percentage of your intent buckets, branded, informational, commercial, comparison, actually returned data in a given run.
Recommendation Share should be your headline KPI. Mention rate and prompt coverage are diagnostics: useful for spotting gaps, not for reporting to a CFO. If a board asks one question about your AI presence, Recommendation Share is the number that answers it, because it maps directly to whether buyers see you as a viable option at the moment they're deciding.
A quick read on share-of-voice measurement helps clarify how these figures should roll up into a single trend line rather than four disconnected charts.
Which AI Engines Should You Measure First?
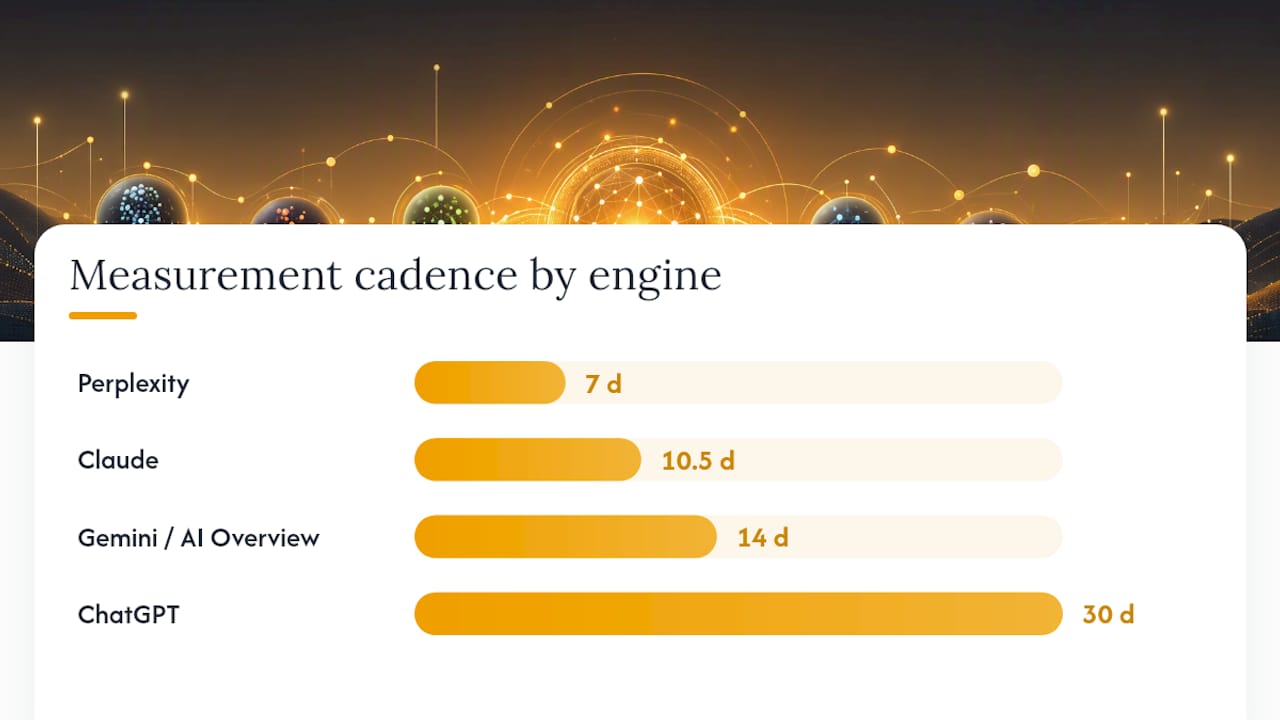
Begin measurement with Perplexity, progressively adding Claude and Gemini, while measuring ChatGPT last due to challenges in reliable measurement.
Perplexity returns structured, extractable citations through its API, which makes it the cleanest starting point for any team building a measurement pipeline from scratch. Claude follows as the second engine, since its web tool is also API-accessible, just with less citation transparency than Perplexity. Gemini and Google's AI Overview come third, typically pulled through search-result or AI-search endpoints rather than a dedicated citation API. ChatGPT comes last because reliable, programmatic measurement of it runs into fragility and terms-of-service friction that the other three don't.
- Perplexity: API access, clean citation objects, live web grounding. Weekly cadence.
- Claude: API-based web tool, usable citations, less structured than Perplexity. Weekly to biweekly cadence.
- Gemini / AI Overview: measured via search or AI-search endpoints, more variable formatting. Biweekly cadence.
- ChatGPT: scraping or approximation methods only, most prone to breaking. Monthly cadence, treated as directional rather than precise.
The variance you'll see across engines isn't noise. It reflects real differences in how each model blends training data, live web search, and licensed content feeds, so a gap on one engine and not another usually points to a fixable, specific problem.
Pro Tip: Don't try to launch all four engines simultaneously. Validate your prompt set and citation logic on Perplexity alone for two to three weeks before adding a second engine. Fixing methodology mistakes on one engine is manageable; fixing them across four at once usually means starting over.
How Do You Build the AI Visibility Measurement Pipeline?
Building this from scratch follows a repeatable sequence, whether you're doing it in spreadsheets first or automating it from day one.
- Compose the query set. Build 20 to 50 prompts split across four intent types: branded ("What do people say about [brand]?"), non-branded informational, non-branded commercial ("best tools for X"), and comparison ("X vs Y"). Ranking Atlas recommends exactly this kind of intent-balanced block as the baseline unit for consistent tracking.
- Design the log. Every run produces one row per engine, per prompt, per date. Snapshots are append-only, never overwritten, so you can graph trend lines instead of losing history to the next update.
- Normalize and disambiguate. Tag brand mentions against known aliases and common misspellings before aggregating, or your share-of-voice number will quietly undercount you.
- Automate incrementally. Start manual on Perplexity, then script the extraction once the methodology is stable, then extend to the next engine.
How Do You Turn Dashboard Data into Prioritized Work?
A dashboard that just displays numbers is a status report. The value shows up when a gap on the screen turns into a ticket with an owner and a deadline.
Score every gap on two axes: impact (how large is the share-of-voice or Recommendation Share gap on high-intent prompts) and effort (is this a content fix, a technical fix, or something that requires third-party mentions you don't control).
- A missing citation on a commercial prompt where competitors dominate: high impact, often a content or schema fix. Assign to content within a week.
- Low prompt coverage on comparison queries: medium impact, usually a new content type. Assign to content strategy for the next sprint.
- Strong mentions but weak citations: technical issue, often crawlability or structured data. Assign to SEO/engineering.
- Absence from AI Overview despite strong organic rank: likely an indexing or schema gap. Assign to technical SEO.
Pro Tip: *Track Recommendation Velocity, the month-over-month change in Recommendation Share, not just the raw number. Connecting this data directly to content workflows shortens the gap between spotting an issue and shipping the fix.
What's a Realistic 90-Day Rollout Plan?
- Days 1 to 30: Run your Perplexity baseline across the full prompt set. Audit crawlability and indexing for pages that should be cited but aren't. Review schema markup on product and comparison pages.
- Days 31 to 60: Add Claude to the pipeline. Assign owners to the top five gaps identified in month one. Publish or update at least two pages targeting weak comparison prompts.
- Days 61 to 90: Add Gemini/AI Overview tracking. Run the first month-over-month Recommendation Velocity report. Build the reporting template: headline KPIs, one paragraph of interpretation, next month's top three priorities.
Keep the monthly report to one page. A short deliverable with a clear interpretation drives faster executive decisions than a 20-slide deck nobody reads past page three.
What Do Successful AI Dashboard Rollouts Look Like in Practice?
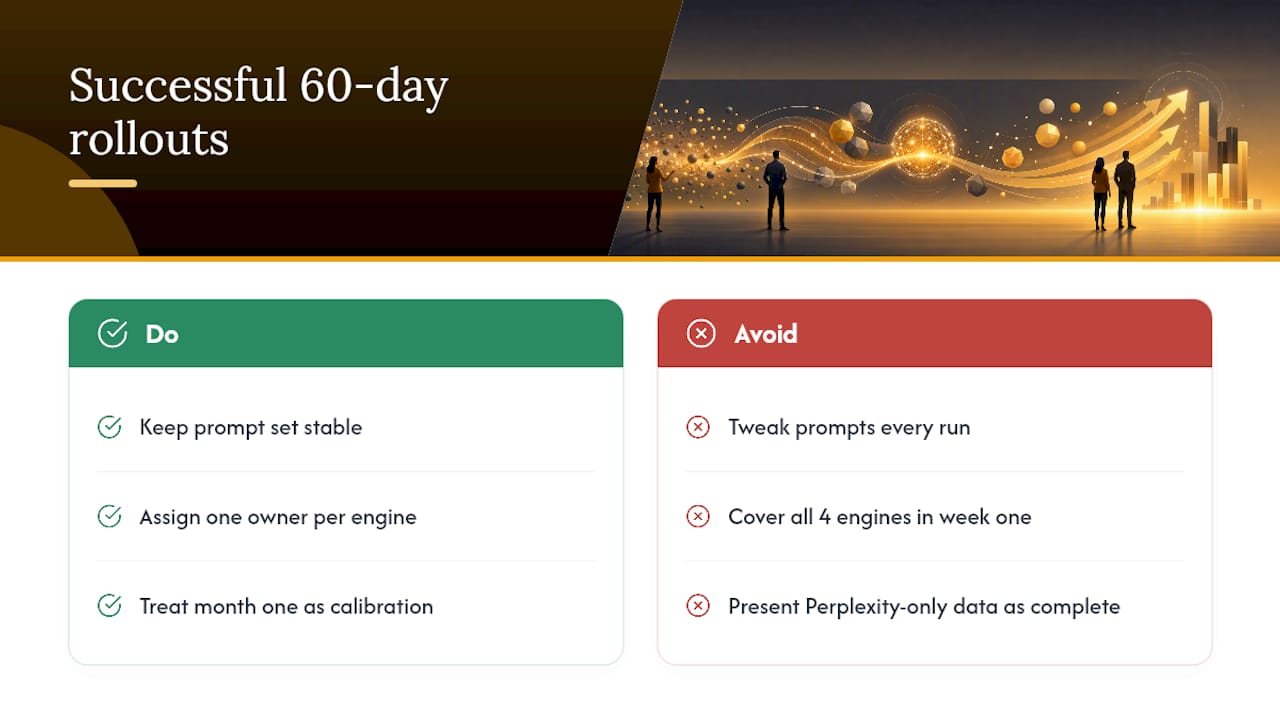
The pattern across teams that get real value from this isn't sophistication. It's discipline in the first 60 days.
Teams that see movement in Recommendation Share within a quarter tend to do three things consistently. They keep the prompt set stable instead of tweaking it every run, because a moving baseline makes trend lines meaningless. They assign a single owner to each engine's data quality, so nobody's guessing whether a data gap is a real drop or a broken script. And they treat the first month as calibration, not reporting, resisting the urge to present incomplete Perplexity-only data to leadership as if it's the full picture.
The failure pattern looks almost identical in reverse: teams that try to cover all four engines in week one usually end up with unreliable data on all four and confidence in none. One mid-market SaaS content team, working from a 30-prompt set split evenly across branded and comparison intents, found that its citation rate on Perplexity was nearly triple its citation rate on ChatGPT for the same query set, a gap traced to structured FAQ schema present on competitor pages and missing on their own. Fixing that schema gap on a dozen priority pages became the entire month-two roadmap, not a scattershot content push.
The lesson that repeats across rollouts: the dashboard's job is to point at one or two fixable things per month, not to produce a comprehensive scorecard nobody has time to act on.
How Should You Evaluate an AI Dashboard Vendor?
Before signing anything, run a short checklist against any AI visibility vendor.
Engine coverage. Confirm which engines they actually measure programmatically versus which they approximate. A vendor that claims full ChatGPT coverage with no caveat about measurement fragility is overselling.
Methodology transparency. Ask how they handle brand disambiguation, how often prompts run, and whether snapshots are append-only or overwritten. If they can't explain the query set design, walk away.
Metric depth. Confirm the platform reports Recommendation Share and citation rate separately, not a single blended "visibility score" that hides the two.
Competitive benchmarking. You need your numbers next to competitors' numbers, not in isolation. Reviewing how a market map clusters brands against each other is a useful gut check on whether a vendor's competitive view is genuinely useful or just cosmetic.
Workflow connection. Does the dashboard hand off to content and technical teams with clear ownership, or does it dead-end at a chart?
Trial structure. Request a free scan or limited trial before committing to an annual contract. A vendor confident in its methodology should let you see real output on your own brand before you pay for a full year. Ask specifically what a baseline scan covers, and whether it includes your named competitors out of the gate.
What Should the Dashboard Interface Actually Look Like?
The best AI visibility dashboards resist the urge to show everything at once. A CMO glancing at the screen for 30 seconds should see one headline number per engine, the trend direction, and nothing else competing for attention.
Put Recommendation Share and share of voice above the fold, with engine-level breakdowns one click deeper. Diagnostics like prompt coverage and mention-rate detail belong on a secondary screen for the analyst, not the executive view. Color coding should follow one consistent rule throughout, green for gains, red for drops of a defined threshold, gray for flat, and never change that meaning between screens.
Filtering matters more than most teams expect going in. You need to slice by engine, by intent bucket, and by date range, ideally all three at once, without the interface collapsing into a wall of dropdowns. A search bar for individual prompts helps analysts debug a specific gap without paging through hundreds of rows.
Avoid overloading a single view with every metric defined in this guide. Mention rate, citation rate, Recommendation Share, Recommendation Position, and prompt coverage all matter, but stacking five line charts on one screen defeats the purpose of a dashboard. Build layered views: a landing screen with the two or three numbers that drive decisions, and drill-down screens for the analyst doing the diagnostic work. Mobile access matters too, since most executives check this kind of report between meetings rather than at a desk.
What Are the Biggest Data Quality Problems in AI Visibility Tracking?
Every team building this pipeline runs into the same three problems, usually in the first month.
API limits and rate throttling. Perplexity, Claude, and Gemini all cap request volume, and a 50-prompt query set run across four engines weekly adds up fast. Budget for this before you scale the prompt set, not after you hit a wall.
Brand disambiguation failures. A generic brand name gets confused with unrelated entities, or a competitor with a similar name pollutes your citation count. This is the single most common source of a dashboard number that looks wrong to anyone who checks it manually.
Format drift. Engines change how they structure citations without warning. A script that parsed Perplexity's citation objects cleanly in January can break silently in March if the API response format shifts. This is exactly why a stable methodology with a citation-extraction layer built for resilience matters more than a clever one-off script.
Normalization across engines. ChatGPT, Claude, Gemini, and Perplexity don't format sources the same way, so aggregating raw output into one share-of-voice number requires a translation layer most teams underestimate on their first build attempt.
The fix for all four isn't more engineering hours. It's smaller, that append-only snapshot habit again: log every run raw before normalizing, so a format change breaks your parser, not your entire history of data.
What Privacy and Security Issues Come Up with AI Marketing Data?
AI visibility monitoring involves sending prompts to third-party AI providers and storing their responses, which raises two distinct questions most marketing teams haven't had to think through before.
The first is what data you're sending. Prompt sets built around your own brand and competitor names carry limited exposure, but teams sometimes get tempted to feed proprietary campaign data or customer language into prompts for "realism." Keep the query set generic and buyer-language-based rather than pulling from confidential campaign documents.
The second is what happens to the responses once stored. AI-generated answers get logged, timestamped, and retained for trend analysis, which means your snapshot store becomes a growing archive of third-party-generated content about your brand and competitors. Apply the same access controls and retention policies you'd use for any customer data warehouse, not an afterthought bolted on once the dashboard is live.
If you're evaluating a vendor rather than building in-house, ask directly where the snapshot data lives, who has access, and how long it's retained. A documented measurement methodology should also spell out data handling, not just metric definitions. That transparency is a reasonable bar to hold any vendor to before you hand them a running feed of your competitive intelligence.
Why Presence Beats Rank in the AI Visibility Conversation
Most marketing leaders still think about AI visibility the way they think about search rank: a position to climb. That's the wrong mental model. AI visibility is closer to binary than search ever was. A buyer asking an AI assistant for a recommendation either gets your brand's name or doesn't, and there's no page two to fall back on.
That changes what a dashboard is for. It's not a scoreboard for slow, incremental gains. It's an early-warning system for the moments you disappear entirely from a buying conversation. Building the full pipeline in-house is doable, and the Perplexity-first approach makes a reasonable starting point for teams with engineering bandwidth. A platform like this exists for the teams that would rather skip the months of pipeline maintenance and get straight to the prioritization work.
— Geraldine
Turn Dashboard Signals into a Monthly Executive Report
If everything above sounds like the right approach but not something your team has the bandwidth to build and maintain, that's exactly the gap this service fills. Its Monthly AI Visibility Report delivers per-engine panels, Recommendation Share tracking, and citation analysis described in this guide as a recurring executive deliverable, so your team spends its time on fixes instead of pipeline maintenance.
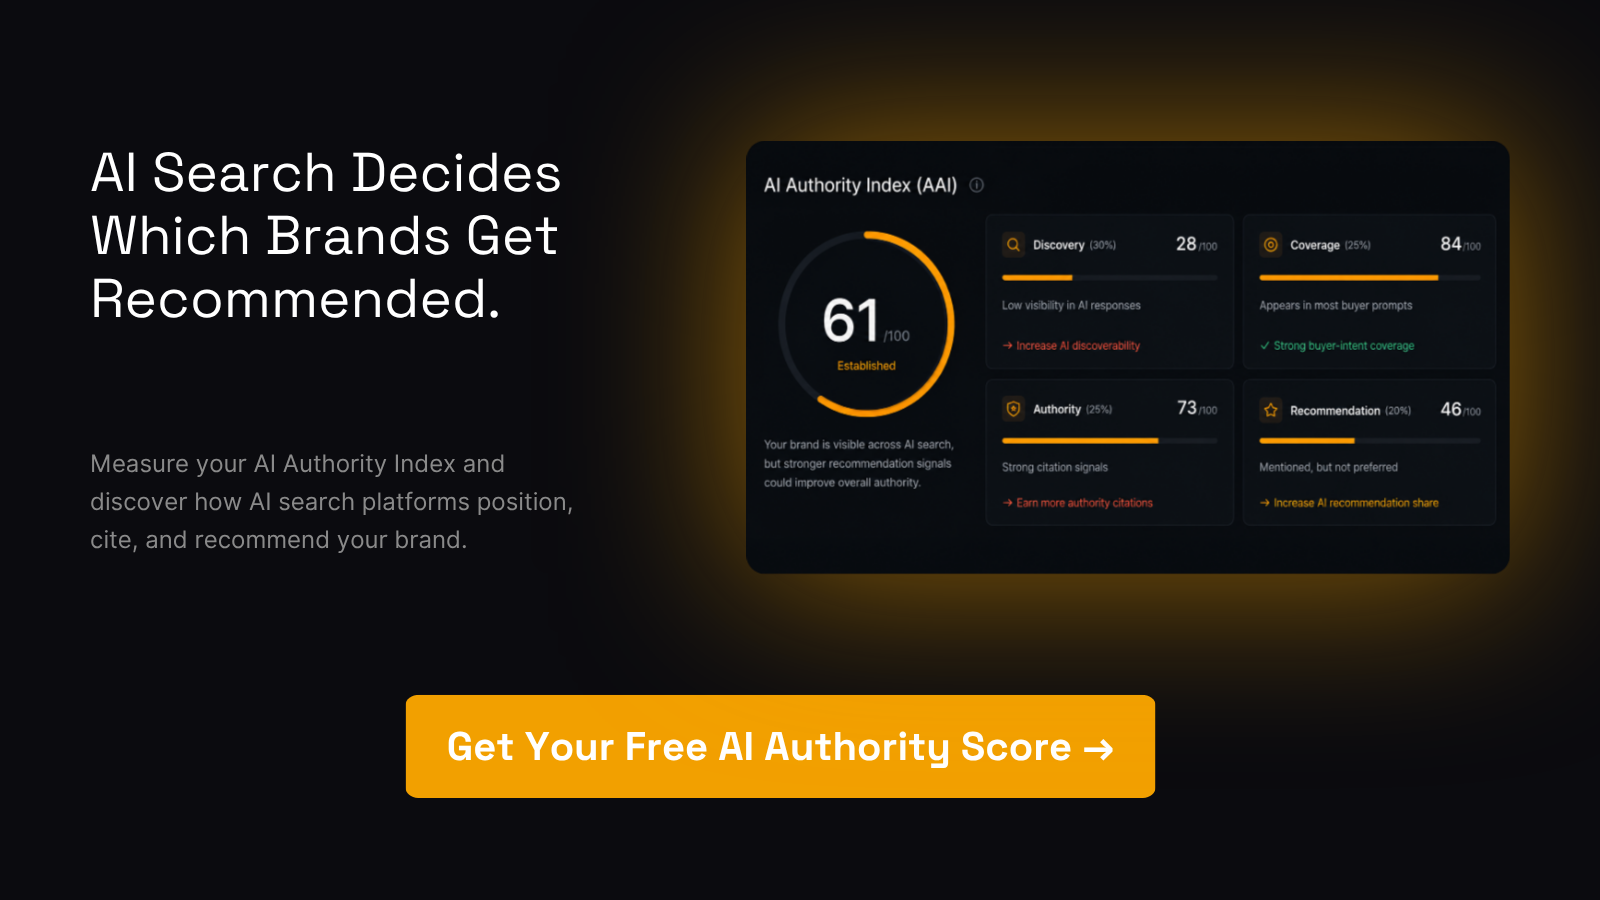
The platform's AI Authority Index rolls share of voice, citation rate, and Recommendation Share into a single score you can track over time and defend to a board. Setup starts with adding your competitors and markets so your baseline is comparative from day one, not a brand-in-isolation number that means little without context. From there, setting up your workspace takes a few minutes. Start with a free scan to see where your brand currently stands across ChatGPT, Gemini, Claude, and Perplexity before deciding whether a full subscription earns its place in next year's budget.
Sources
- AI Search Visibility Stack: How to Measure Brand Share of Voice Across ChatGPT, Claude, Perplexity, and Gemini | Agenticsis
- AI visibility — HubSpot
- How to Measure Brand Visibility in ChatGPT and AI Search: Method and Template | Ranking Atlas
FAQ
What Is a Good Recommendation Share to Aim For?
There's no universal benchmark since it depends heavily on category and competitive density, but a rising month-over-month trend matters more than the absolute number in early tracking.
How Often Should You Update an AI Visibility Dashboard?
Weekly for live-web engines like Perplexity and ChatGPT's browsing mode, and monthly for engines more dependent on training data, since those shift more slowly between updates.
Do I Need to Track All Four Major AI Engines from Day One?
No. Start with Perplexity for a clean baseline, then add Claude, Gemini, and ChatGPT in that order as your methodology stabilizes.
What's the Difference Between Share of Voice and Recommendation Share?
Share of voice measures how often you're mentioned across all AI answers; Recommendation Share measures the narrower, more commercially direct case of being actively recommended on buying-intent prompts.
Can AuthorityLayer Replace a DIY AI Visibility Pipeline?
For teams without dedicated engineering resources to maintain per-engine citation extraction, a platform like AuthorityLayer's AI Authority Index consolidates the same metrics into a maintained, comparative dashboard.