AI Share of Voice: Measure and Grow Your Brand's Presence in LLMs
Discover how to measure and grow your brand's presence with AI share of voice. Learn key metrics to enhance visibility in LLMs today!
· 19 min read

AI share of voice (AI SoV) is the percentage of AI-generated responses, across a defined set of prompts and monitored engines, that mention or recommend your brand. The formula is straightforward:
AI SoV = brand mentions ÷ total relevant AI responses × 100
Run a pilot of a moderate prompt sample across multiple engines (ChatGPT, Gemini, Claude, Perplexity) this week. That single exercise will tell you more about your brand's actual buyer-stage visibility than a month of traditional rank tracking.
Start by measuring these three signals:
- Mention rate: the share of responses that name your brand at all
- Recommendation rate (share of recommendations): the share where your brand is actively suggested as a solution
- Citation rate: the share where your brand is linked or attributed as a source
The distinction between mention rate and recommendation rate matters more than most teams realize. Being named is not the same as being chosen. Tracking both from day one prevents you from optimizing the wrong number.
Table of Contents
- Why AI share of voice is now a revenue-stage metric
- Core metrics and formulas you must track
- A reproducible workflow for measuring AI SoV across platforms
- How to automate AI SoV measurement at scale
- Proven tactics to improve your recommendation share
- How to build dashboards and set reporting cadence
- Data quality, common pitfalls, and how to validate your measurements
- Setting targets and monitoring improvement over time
- Key Takeaways
- The gap between being in the conversation and winning the decision
- Authoritylayer gives you a complete picture of your AI recommendation share
- Useful sources
- FAQ
Why AI share of voice is now a revenue-stage metric
Traditional share of voice measures exposure: how often your brand appears in paid or earned media relative to competitors. AI SoV measures something closer to decision influence. When a buyer asks ChatGPT "what's the best project management tool for a 50-person team," the engine's answer functions like a trusted advisor's recommendation, not a billboard.
That shift has a concentration problem baked into it. Across ChatGPT, Perplexity, and Claude, approximately 2% of brands capture around 80% of generative product recommendations. The brands outside that 2% are not invisible because of low ad spend. They are invisible because AI engines weight corroborated third-party signals: editorial coverage, review volume, schema consistency, and named entity recognition.
Approximately 2% of brands capture around 80% of generative product recommendations across major AI engines. If your brand is not actively tracking recommendation share, you are almost certainly in the 98%.
That concentration compounds over time. Consistent editorial coverage across multiple authoritative outlets acts as a multiplier for AI citation likelihood, which means the brands already in the conversation tend to stay there. Waiting six months to start measuring means six months of compounding disadvantage.
The revenue connection is direct. A brand that appears in AI-generated answers at the consideration and decision stages of a buyer's research journey gets evaluated. A brand that does not appear does not get evaluated. AI SoV is the metric that tells you whether you are in the room when the decision is being shaped.
Core metrics and formulas you must track
AI share of voice measures the percentage of AI-generated responses for a tested prompt set that mention your brand, but that top-line number hides four distinct signals worth separating.
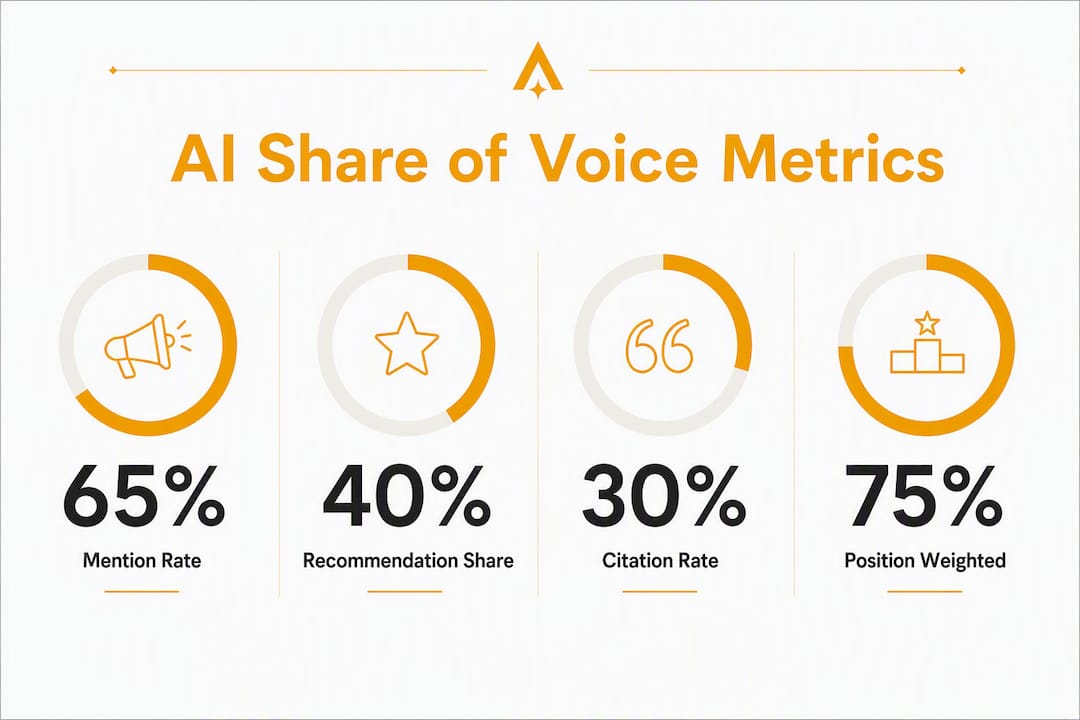
Mention rate
Mention rate = responses mentioning your brand ÷ total responses tested × 100
This is the broadest measure. A brand mentioned in passing in a list of ten options scores the same as a brand given a full paragraph of praise. Useful as a baseline; not sufficient on its own.
Recommendation share (share of recommendations)
Share of recommendation measures how often an answer engine recommends a brand across a fixed set of buyer prompts, focusing on selection rather than exposure. A response counts only when the engine actively suggests your brand as a solution, not merely names it.
Recommendation share = prompts where your brand is recommended ÷ total relevant prompts tested × 100
This is the metric most directly tied to buyer decisions.
Citation rate
Citation rate tracks responses where your brand is linked or attributed as a source. High citation rate signals that engines treat your content as authoritative reference material, which correlates with stronger recommendation probability over time.
Position-weighted SoV
Raw mention counts treat a first-position recommendation the same as a buried fifth mention. Position weighting and demand adjustments ensure that first mentions on high-volume prompts are prioritized, giving you a metric that correlates better with actual buyer influence.
Weighted SoV = Σ (mention score × position weight × prompt volume weight)
A simple weighting scheme: first position = 1.0, second = 0.75, third = 0.5, fourth or lower = 0.25.
Example calculation with a 50-prompt sample
| Metric | Raw Count | Total Prompts | Score |
|---|---|---|---|
| Mention rate | — | 50 prompts | — |
| Recommendation share | — | 50 prompts | — |
| Citation rate | 8 citations | 50 prompts | — |
| Position-weighted SoV | — | 50 prompts | — |
Pro Tip: When scoring ambiguous responses, apply a three-tier rule: explicit recommendation ("I'd suggest Brand X") = 1.0, qualified mention ("Brand X is worth considering") = 0.5, incidental name-drop in a list with no context = 0.0. Log the raw response text so you can audit scoring decisions later.
A reproducible workflow for measuring AI SoV across platforms
Getting consistent, comparable data across engines requires a structured process. Here is a step-by-step workflow you can run with a small team or automate with the right tooling.
1. Define your prompt set by intent bucket. Group prompts into bottom-funnel (vendor comparison, "best X for Y"), mid-funnel (category education, "how do I solve X"), and top-funnel (awareness, "what is X"). A pilot prompt set might include a range of bottom-funnel, mid-funnel, and top-funnel prompts. Bottom-funnel prompts drive the highest recommendation rates and should anchor your baseline.
Example prompts:
- Bottom-funnel: "What's the best AI visibility monitoring platform for a B2B SaaS company?"
- Mid-funnel: "How do marketing teams track brand mentions in AI-generated answers?"
- Top-funnel: "What is generative engine optimization?"
2. Choose your engines and standardize conditions. Start with major AI engines such as ChatGPT, Gemini, Claude, and Perplexity. Use the same model version, the same temperature settings where API access allows, and the same prompt phrasing across all engines. Any variation in phrasing is a confound, not a data point.
3. Run prompts and capture full responses. Log the complete response text, not just a mention/no-mention flag. You need the surrounding context to score recommendation strength and position. Record: engine name, model version, timestamp, prompt ID, and full response text.

4. Deduplicate and normalize mentions. A single response may mention your brand three times. Count it once per response for mention rate, but log position of first mention separately. Normalize brand name variants ("AuthorityLayer," "Authority Layer," "AL platform") to a single canonical entity before scoring.
5. Apply your scoring rules consistently. Use the three-tier scoring rule from the metrics section. Score each response independently, then aggregate by prompt, by engine, and across the full set.
6. Aggregate per-engine results into a single SoV figure. Weight each engine by its estimated share of AI-assisted buyer research in your category. If you lack category-specific data, equal weighting across four engines is a defensible starting point. Document your weighting rationale so you can revisit it as engine usage shifts.
7. Set cadence. Run the full 50–100 prompt set monthly. Add weekly spot-checks of 10–15 high-priority bottom-funnel prompts to catch sudden drops. Quarterly, expand the prompt set to capture new buyer questions that have emerged.
How to automate AI SoV measurement at scale
Manual prompt-running works for a pilot. It does not scale to monthly tracking across four engines with a 100-prompt set and five competitors. The right automation approach depends on your team's technical depth.
AI visibility platforms handle the full workflow: prompt scheduling, response capture, scoring, deduplication, and dashboard aggregation. Authoritylayer is built specifically for this use case, running structured prompt sets across ChatGPT, Claude, Gemini, and Perplexity and surfacing recommendation share, mention rate, and competitive benchmarks in a single interface. For teams that need to track AI SoV as an ongoing KPI rather than a one-time audit, a dedicated platform removes the manual overhead that kills measurement consistency. The best AI visibility tools guide covers what to look for when evaluating options.
API-based sampling scripts work for teams with engineering resources. OpenAI, Anthropic, and Google all offer API access to their models. You can build a scheduled script that runs your prompt set, stores raw responses in a data warehouse (BigQuery, Snowflake), and feeds a BI dashboard. The limitation: Perplexity's web-augmented responses and some Gemini configurations are harder to replicate via API in a way that mirrors real user experience.
RPA and browser automation (Playwright, Puppeteer) can capture responses from interfaces that lack API access, but these approaches break when UI changes and require ongoing maintenance.
Integration touchpoints to build in: connect your AI SoV data to your SERP rank tracker, your review platform (to correlate review volume changes with SoV shifts), and your schema monitoring tool. That triangulation is what turns AI SoV from an isolated metric into a signal with causal explanatory power.
The brands winning AI recommendation share are not running bigger ad budgets. Industry analysts note that traditional ad spend has minimal direct impact on AI recommendation volume; what moves the needle is authority signals: third-party review sentiment, schema consistency, and named entity recognition.
Set anomaly alerts for SoV drops greater than 5 percentage points week-over-week on your highest-priority prompts. A sudden drop often signals a model update, a competitor's editorial push, or a schema error on your site.
Proven tactics to improve your recommendation share
Share of recommendation is shaped more by authority signals than by advertising spend. Editorial coverage, review corpora, and structured data are the primary levers. Here is a prioritized sequence.
1. Build third-party editorial coverage first. This is the highest-leverage tactic and the slowest to execute. AI engines weight corroborated information: your brand mentioned and described consistently across multiple authoritative publications is far more citation-worthy than a well-optimized homepage. Target publications your buyers actually read. Aim for coverage that includes your brand name, category, and key differentiators in the same paragraph. The AI trust signals guide covers which signal types carry the most weight with each engine.
2. Build and maintain a review corpus. Volume and recency both matter. A brand with 200 recent reviews across G2, Capterra, and Google is more corroborated than one with 20 reviews from three years ago. Assign a team member to own review generation as an ongoing program, not a one-time push. Sentiment consistency matters too: engines that summarize reviews will surface the dominant narrative.
3. Fix schema and entity consistency. Your brand name, description, founding date, product categories, and key personnel should be identical across your website schema, Google Business Profile, Wikidata, Crunchbase, LinkedIn, and any industry directories. Inconsistency creates entity ambiguity that reduces citation confidence. Run a schema audit before any content push.
4. Create recommendation-ready content. AI engines pull from content that directly answers buyer questions. Structure your content around the exact questions your buyers ask at each funnel stage. Use clear headers, concise definitions, and comparison language ("Brand X vs. Brand Y") that mirrors how buyers frame their queries. FAQ schema on these pages increases the probability of direct citation.
5. Optimize for positioning language. The language engines use to describe your brand in recommendations reflects the language in your most-cited sources. If you want to be described as "the leading platform for X," that phrase needs to appear in third-party sources, not just your own copy. Work with PR and content teams to align messaging across owned, earned, and partner channels.
6. Sequence technical fixes before content pushes. Schema errors and entity inconsistencies suppress citation probability regardless of content quality. Fix the technical foundation first. A brand in a "citation desert" because of inconsistent entity records will see minimal lift from new content until the underlying data quality improves.
How to build dashboards and set reporting cadence
Recommendation metrics must be framed as a share versus competitors to be strategically useful. A standalone SoV figure tells you where you are; a competitive SoV figure tells you whether you are gaining or losing ground.
Dashboard components
| Dashboard Element | What to Show | Audience |
|---|---|---|
| Overall AI SoV | Brand SoV % vs. top 3 competitors, trendline | Executive |
| Mention vs. recommendation split | Side-by-side bar, current period vs. prior | Marketing lead |
| Per-engine breakdown | SoV % by ChatGPT, Gemini, Claude, Perplexity | SEO/GEO owner |
| Position-weighted SoV | Weighted score vs. raw mention rate | SEO/GEO owner |
| Citation sources table | Top 10 sources driving citations, by engine | Content/PR team |
| Prompt-level detail | Which prompts drive mentions vs. recommendations | Tactical owner |
Reporting cadence
Weekly: spot-check 10–15 priority bottom-funnel prompts. Flag anomalies. No full report needed; a Slack summary with the delta is sufficient.
Monthly: full prompt set run, competitive benchmarking, dashboard update. Share with marketing leadership. Include a "what changed and why" narrative alongside the numbers.
Quarterly: strategy review. Reassess prompt set relevance, update competitor list, review weighting assumptions, and connect SoV trends to pipeline and revenue data. This is the meeting where you decide whether to escalate investment or shift tactics.
Pro Tip: Report mention rate and recommendation share separately to executives. Executives who see only a combined SoV figure may optimize for mentions; recommendation share is more closely linked to revenue influence.
Data quality, common pitfalls, and how to validate your measurements
AI SoV data is only as reliable as the process that generated it. These are the failure modes that most commonly corrupt measurements.
- Prompt leakage: using prompts that are too specific to your brand (e.g., including your brand name in the prompt) inflates mention rates artificially. Prompts should reflect how a buyer who does not yet know your brand would phrase the question.
- Small sample bias: a 10-prompt pilot produces results with wide variance. A single model update can swing a 10-prompt result by 20 percentage points. Fifty prompts is the practical minimum for a stable baseline; 100 is better.
- Deduplication errors: counting multiple mentions within a single response as separate data points inflates raw mention counts. Score at the response level, not the mention level.
- Ambiguous mention scoring: without a written scoring rubric, two analysts will score the same response differently. Document your three-tier scoring rule and apply it before anyone scores live data.
- Model update drift: engine models update without announcement. A sudden SoV shift may reflect a model change rather than a real-world change in your brand's authority. Cross-engine triangulation helps: if SoV drops on one engine but holds on others, suspect a model update rather than a brand signal change.
- Ignoring answer accuracy: a mention in a factually incorrect response can be worse than no mention. Log whether the engine's description of your brand is accurate, and flag inaccurate descriptions for correction via your entity and content strategy.
Authoritylayer's measurement methodology addresses these pitfalls through structured prompt design, automated deduplication, and inter-rater scoring validation. For teams building their own measurement stack, the methodology page is a useful reference for validation standards.
Validation checklist:
- Audit 10% of scored responses manually each month
- Cross-engine triangulation: compare SoV trends across all monitored engines before drawing conclusions
- Back-test against known events (a major press mention, a product launch) to confirm your measurement captures real-world signal changes
- Review prompt set quarterly for relevance drift as buyer language evolves
Setting targets and monitoring improvement over time
Start with a baseline, not a target. Run your 50–100 prompt pilot, establish your current mention rate and recommendation share, and map your top three competitors' scores on the same prompt set. That competitive baseline is the only meaningful reference point for target-setting.
Realistic improvement timelines depend on your starting position and the tactics you deploy. Editorial coverage takes 60–90 days to appear in AI training cycles and citation indexes. Schema fixes can show impact in 30–45 days. Review volume changes typically take 45–60 days to influence recommendation language.
A simple experiment template:
- Hypothesis: "Publishing three authoritative bylines in [target publication] will increase recommendation share on bottom-funnel prompts by X percentage points within 90 days."
- Control: hold your prompt set and scoring rules constant.
- Observation window: 90 days minimum for editorial tactics; 45 days for schema and review changes.
- Success threshold: a 3–5 percentage point improvement in recommendation share is a meaningful signal in most categories. Smaller movements within a 90-day window are within normal variance.
Set escalation thresholds: if recommendation share drops more than 8 percentage points in a single monthly measurement, treat it as a priority incident. Investigate prompt set changes, model updates, and competitor editorial activity before assuming a brand signal problem.
When spot-checks show consistent improvement over three consecutive months, that is the signal to move from tactic iteration to strategic investment: expanding the editorial program, building a dedicated GEO content function, or deploying a platform like Authoritylayer for continuous monitoring.
Key Takeaways
Measuring AI share of voice requires separating mention rate from recommendation share, running a structured prompt set across multiple engines, and benchmarking against competitors to make the metric strategically useful.
| Point | Details |
|---|---|
| Start with a 50-prompt pilot | Run 50–100 prompts across ChatGPT, Gemini, Claude, and Perplexity to establish a baseline before setting targets. |
| Track recommendation share, not just mentions | Recommendation share (prompts where your brand is actively suggested) predicts revenue influence; mention rate alone does not. |
| Authority signals beat ad spend | Editorial coverage, review volume, and schema consistency drive AI recommendation probability more than paid media. |
| Benchmark competitively | A standalone SoV figure has limited value; always report your score relative to top competitors. |
| Authoritylayer automates the full workflow | Authoritylayer tracks mention rate, recommendation share, and competitive benchmarks across major LLMs in a single platform. |
The gap between being in the conversation and winning the decision
Most teams, when they first measure AI SoV, are relieved to find their brand mentioned at all. That relief is the trap.
Being in the conversation and winning the recommendation are structurally different outcomes. A brand can appear in 60% of AI responses and still lose the buyer decision if it appears as an afterthought in a list of eight options, described in one generic sentence, while a competitor gets two paragraphs of specific, corroborated detail. The engines are not neutral: they weight the depth and quality of corroboration, not just the presence of a name.
The counterintuitive lesson from tracking this metric closely is that citation deserts are almost always a technical problem before they are a content problem. Brands that fix entity consistency and schema first, then layer editorial coverage on top, see compounding lift. Brands that publish more content without fixing the underlying entity record often see no movement at all, because the engine cannot confidently attribute the content to a single, well-defined brand.
The other surprise: the time lag is longer than most teams expect, and shorter than most executives will tolerate. Editorial work that starts today will likely show up in AI citation patterns in 60–90 days, sometimes longer. That timeline requires setting expectations early and tracking leading indicators (editorial placements, review velocity, schema health) alongside the lagging indicator of SoV itself.
The brands that will own AI recommendation share in their categories are the ones that started measuring and building authority signals before their competitors did. The measurement is not the hard part. The discipline to keep running it, month after month, and connecting it to the tactics that actually move it, is where most teams fall short.
Authoritylayer gives you a complete picture of your AI recommendation share
Knowing your AI SoV number is one thing. Knowing which prompts drive it, which competitors are outranking you on specific buyer questions, and which authority signals to fix first is what actually moves the metric.

Authoritylayer monitors your brand's recommendation share across ChatGPT, Claude, Gemini, and Perplexity on a structured, repeatable prompt set, then benchmarks your results against competitors in real time. The platform surfaces which citation sources are driving competitor recommendations, flags entity and schema inconsistencies, and delivers prioritized recommendations so your team knows exactly where to focus.
The Starter plan is built for teams running their first AI visibility audit: you get a baseline scan, mention and recommendation rate by engine, and a competitive snapshot. The Growth plan adds continuous monitoring, prompt tracking, and the prioritized improvement workflow. For multi-brand organizations or teams that need custom prompt sets and API access, the Enterprise plan delivers the full stack with dedicated support.
Every measurement Authoritylayer produces follows a documented methodology that addresses the data-quality pitfalls covered in this guide: prompt design standards, deduplication rules, scoring validation, and cross-engine triangulation.
Run your first AI visibility scan with Authoritylayer's Starter plan, or explore the Enterprise offering if your organization needs competitive intelligence at scale.
Useful sources
The sources below support the methodology and evidence in this guide. Authoritylayer's own methodology pages are listed first for transparency; external research follows.
- How AI visibility is measured — Authoritylayer Academy: canonical methodology reference for prompt design, scoring, and validation standards.
- Visibility vs. recommendation — Authoritylayer Academy: explains the structural difference between mention-based and recommendation-based metrics.
- AI Share of Recommendation: Beyond Share of Voice — SolCrys: primary evidence for the recommendation vs. mention distinction and scoring guidance.
- The AI Search Citation Economy — Hexagon Blog: source for the 2%/80% recommendation concentration finding and editorial density analysis.
- Share of recommendation — Boo.st: covers authority signals (editorial, schema, reviews) as primary drivers of recommendation share.
- Chapter 2: AI Share of Voice — Waikay: concise definition and prompt universe framing.
- AI Share of Voice: How to Track and Grow Your Brand's Presence in LLM Answers — Nightwatch: position weighting and dashboard field recommendations.
- Recommendation Share: Measuring Influence, Discoverability, and Competitive Position — RankWorks: competitive framing for recommendation metrics.
FAQ
What does AI share of voice mean?
AI share of voice is the percentage of AI-generated responses, across a defined prompt set and set of monitored engines, that mention or recommend your brand. It is calculated as brand mentions divided by total relevant AI responses, multiplied by 100.
What does 50% share of voice mean?
A 50% AI share of voice means your brand appears in half of the AI-generated responses tested across your prompt set. It does not indicate recommendation strength; you need to separate mention rate from recommendation share to understand whether that 50% reflects active suggestions or incidental name-drops.
How do you track AI share of voice?
Define a prompt set of 50–100 buyer-intent queries, run them consistently across ChatGPT, Gemini, Claude, and Perplexity, score each response for mentions and recommendations, and aggregate the results into a percentage. Platforms like Authoritylayer automate this workflow and add competitive benchmarking and anomaly detection.
What is a good share of voice percentage?
There is no universal benchmark, since AI SoV varies sharply by category and competitive density. The more useful frame: approximately 2% of brands capture around 80% of generative recommendations across major engines, so the practical goal is to be in the top tier for your specific category's buyer prompts, not to hit an absolute number.
How is recommendation share different from mention rate?
Mention rate counts any response that names your brand. Recommendation share counts only responses where the engine actively suggests your brand as a solution, making it the metric more directly tied to buyer decisions and revenue influence.