LLM Evaluation Frameworks for Marketing Leaders
Discover a six-metric framework for evaluating LLM performance in marketing. Measure brand mentions, recommendations, and consistency across AI platforms.
· 13 min read

The most defensible way to measure whether AI assistants mention, cite, and recommend your brand is a six-metric framework built around LCRS: LLM consistency and recommendation share. Authoritylayer and practitioners at Search Engine Land have formalized this approach into a measurement system any marketing team can run across ChatGPT, Gemini, Perplexity, and Claude. The six metrics are:
- Brand Mention Rate — how often your brand appears in relevant AI responses
- Recommendation Share — how often your brand is the one actively recommended
- Source Citation Rate — how often AI responses cite your owned or earned content
- Accuracy Rate — how correctly AI assistants describe your brand, products, and claims
- Query Coverage Rate — what share of your target query set your brand appears in at all
- Cross-Platform Consistency Rate — how consistently your brand appears across different engines
Start this week: run a pilot with a balanced set of queries across ChatGPT, Gemini, and Perplexity. This sprint rapidly produces a defensible baseline.
Key Takeaways
A six-metric LCRS framework gives marketing leaders a repeatable, defensible system for measuring AI-driven brand visibility across ChatGPT, Gemini, Perplexity, and Claude.
| Point | Details |
|---|---|
| Start with 50 prompts | Run a balanced basket across three engines to establish a baseline in days, not quarters. |
| LCRS is the core KPI | Recommendation Share combined with Cross-Platform Consistency Rate tells you how reliably AI assistants recommend your brand. |
| 11% domain overlap across engines | Engine-specific strategies are required; a single-engine measurement program misses most of the picture. |
| Composite score plus six metrics | A composite AI Visibility Score (0–100) works for leadership reporting, but always present the six underlying metrics alongside it. |
| Authoritylayer accelerates the pilot | The platform operationalizes multi-engine sampling, citation tracking, and executive scorecards without manual spreadsheet work. |
Table of Contents
- What do LLM evaluation frameworks mean for marketing teams?
- The six-metric AI-visibility framework: definitions, formulas, and a worked example
- How to measure: building your prompt set, sampling protocol, and cadence
- How to interpret the six metrics together
- What a qualified AI visibility report should include
- Operationalizing LCRS: roles, integrations, and a 90-day pilot plan
- Key limitations and risks in LLM-based visibility measurement
- Composite scoring: a spreadsheet-ready formula and sample calculation
- How Authoritylayer operationalizes this framework
- GEO versus traditional SEO: a perspective for CMOs
- Your AI visibility baseline is one pilot away
- Recommended reading
- Sources
- FAQ
What do LLM evaluation frameworks mean for marketing teams?
For ML engineers, "LLM evaluation" means benchmarks and datasets that test model capability. For marketing leaders, it means something entirely different: a structured system for measuring whether AI assistants surface, describe, and recommend your brand during buyer research. The surfaces that matter are:
- ChatGPT (GPT-4o and browsing-enabled modes)
- Google Gemini (including AI Overviews in Search)
- Perplexity (real-time web retrieval with citations)
- Claude (Anthropic's assistant, increasingly used in enterprise workflows)
- Microsoft Copilot (embedded in productivity tools and Bing)
Traditional SEO optimizes for a rank position on a results page. Generative Engine Optimization (GEO) optimizes for inclusion in a synthesized answer. The distinction matters because AI search visibility is not about position 1 versus position 3. It is about whether you appear at all, whether you are recommended over a competitor, and whether what the AI says about you is accurate. Adobe recommends shifting from rank-based KPIs to measuring presence and recommendation share in AI search and tying citation signals to downstream referral traffic.
The six-metric AI-visibility framework: definitions, formulas, and a worked example
5WPR defines these six metrics with formulas and reporting guidance that communications and marketing teams can implement directly.
| Metric | What it measures | Business question answered |
|---|---|---|
| Brand Mention Rate | Responses mentioning your brand ÷ total responses | Are we in the conversation at all? |
| Recommendation Share | Responses recommending your brand ÷ total responses | Are we the preferred answer? |
| Source Citation Rate | Responses citing your content ÷ total responses | Does our content earn authority? |
| Accuracy Rate | Accurate brand descriptions ÷ total brand mentions | Is the AI saying true things about us? |
| Query Coverage Rate | Queries where brand appears ÷ total queries tested | How broad is our topic footprint? |
| Cross-Platform Consistency Rate | Engines where brand appears ÷ engines tested | Are we consistent across platforms? |
LCRS combines LLM consistency (how reliably you appear across repeated runs and platforms) with recommendation share (how often you are the named pick). Together, they answer the question every CMO actually cares about: how often and how reliably does an LLM recommend us, not just mention us? Search Engine Land frames LCRS as the core SEO KPI for the LLM era, built around prompt sets, multi-engine sampling, and trend analysis over time.
Worked example: 50 prompts run across ChatGPT, Gemini, and Perplexity = 150 total responses.
Pro Tip: Define your "qualifying recommendation" rule before you run a single prompt. A brand mention is not a recommendation. Set a clear threshold: the AI must name your brand as a top pick, suggest it by name, or include it in a ranked list. Document that rule in your baseline fields so results are comparable across runs.
How to measure: building your prompt set, sampling protocol, and cadence
A reproducible protocol does not require expensive tooling. Here is the step-by-step approach:
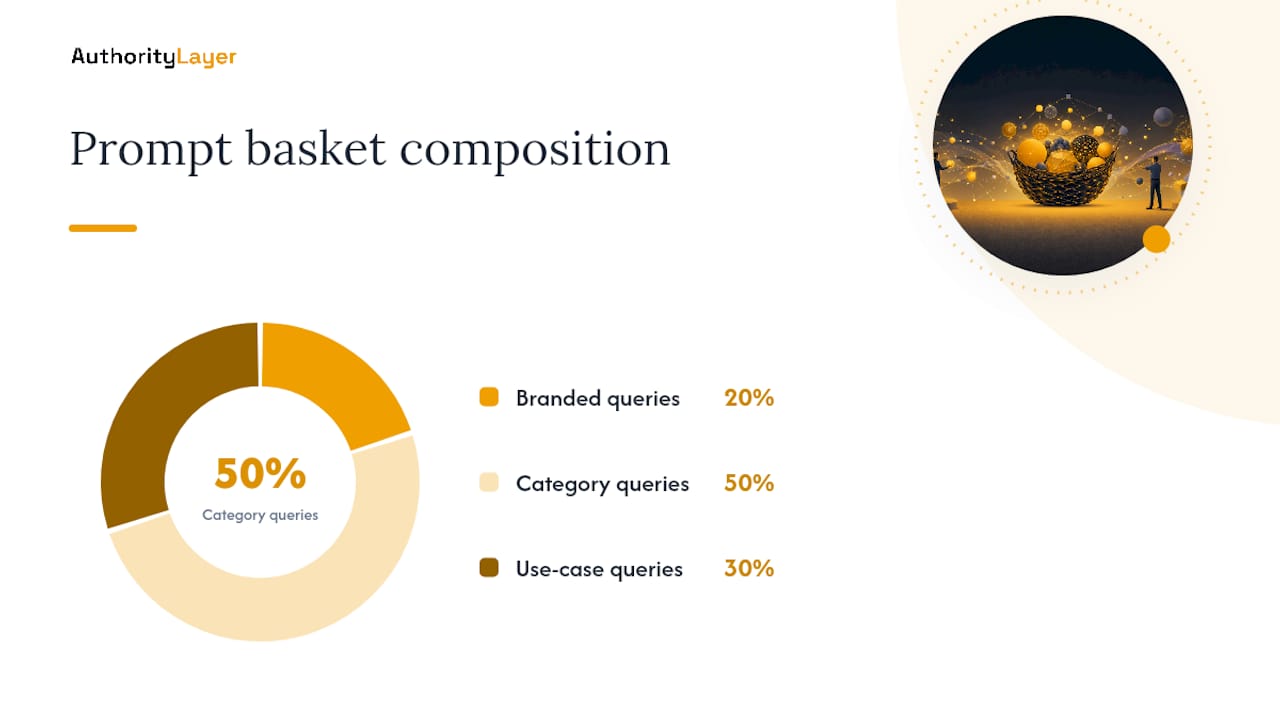
- Build your prompt basket. Aim for 50 prompts split across three types: branded queries ("What does [Brand] do?"), category queries ("What's the best [product category] for [use case]?"), and use-case queries ("How do I solve [specific problem]?"). A roughly 20/50/30 split works for most B2B brands.
- Prepare your sessions. Use incognito or private browsing windows, a US IP address, and a logged-out state. This reduces personalization artifacts that would skew results.
- Run across selected engines. Execute the full prompt basket on each platform in the same session window, ideally within 24 hours, to minimize model-update interference.
- Record baseline fields for every response: prompt text, platform, model/mode (e.g., GPT-4o with browsing), date and location, competitive group tested, qualifying-recommendation rule applied, whether the brand appeared, citation sources listed, and any accuracy notes.
- Classify and review. Flag any response where brand accuracy is ambiguous for human review. Do not let automated classification handle disputed cases.
On cadence: CrawlSense recommends a mixed automated and human-review protocol with weekly checks for live-retrieval engines like Perplexity and browsing-enabled ChatGPT, and monthly checks for training-data-dependent engines. A 12-week trailing window gives you a trend line that is statistically meaningful rather than reactive to a single model update.
Pro Tip: Programmatic API sampling scales collection, but API responses can differ from live UX responses. Run occasional live-session spot checks alongside your API pipeline and document the gap. This matters most for accuracy classification, where a human reading the actual interface catches nuances an automated parser misses. Structured AI output observability practices help teams formalize this review layer.
How to interpret the six metrics together
No single metric tells the full story. The patterns across metrics are where the signal lives.
| Pattern | Interpretation | Recommended action |
|---|---|---|
| High Mention Rate, low Recommendation Share | You are in the conversation but not the preferred answer | Improve third-party endorsements, case studies, and comparison-page presence |
| High Recommendation Share, low Citation Rate | AI recommends you but does not cite your content | Publish citable, structured content; add schema markup; earn press mentions |
| Low Accuracy Rate | AI is saying wrong things about your brand | Submit corrections via official channels; update authoritative sources like Wikipedia and G2 |
| Low Query Coverage Rate | Narrow topic footprint | Expand content into adjacent use cases and category-level queries |
| Low Cross-Platform Consistency Rate | Strong on one engine, invisible on others | Run engine-specific diagnostics; cited domain overlap across engines averages only 11%, so engine-specific tactics are not optional |
When Accuracy Rate drops while Mention Rate holds steady, that is a reputation risk, not a visibility win. Treat it as a PR and content emergency, not a metric fluctuation.
What a qualified AI visibility report should include
A report that serves both the CMO and the practitioner team needs two distinct layers.
Executive summary layer:
- One-paragraph verdict on current AI visibility position versus competitors
- Trend callout (improving, declining, or volatile over the trailing period)
- Immediate risk (low Accuracy Rate, missing from a key engine) and top opportunity
Practitioner layer:
- Six-metric scorecard with current values, prior-period comparison, and targets
- Platform comparison table separated by engine and model
- Per-prompt results log with classification notes
- Accuracy review log with disputed classifications documented
- Citation-source analysis (which domains are being cited in your category)
- Prioritized recommended actions with owner and timeline
A qualified report structure, as outlined by 5WPR, includes query ownership mapping and a citation-source analysis alongside the scorecard. Without those two elements, you cannot diagnose why a metric is low, only that it is low.
Operationalizing LCRS: roles, integrations, and a 90-day pilot plan
| Role | Responsibility |
|---|---|
| CMO | OKR alignment, executive reporting, budget for tooling |
| Head of SEO/GEO | Prompt set design, content gap fixes, schema implementation |
| Analyst | Sampling execution, human review, dashboard maintenance |
| PR/Comms | Earned source development, accuracy corrections, media relationships |
| Engineering | Schema markup, indexing health, API integration for data collection |
90-day pilot milestones:
- Days 1–14: Lock the 50-prompt basket, assign roles, run baseline across ChatGPT, Gemini, and Perplexity. Document all six metrics.
- Days 15–45: Execute weekly sampling cadence. Begin content and schema fixes based on baseline findings. PR team targets two to three new earned citations.
- Days 46–90: Run a second full baseline. Compare metrics. Produce the first executive-ready scorecard. Present trend data and prioritized actions to leadership.
KPIs to report at day 90: Recommendation Share delta, Accuracy Rate, and Cross-Platform Consistency Rate. Those three tell leadership whether the program is working.
Key limitations and risks in LLM-based visibility measurement
- Model nondeterminism: LLM outputs vary run to run. Treat any single result as directional. Build trend lines across at least 12 weeks of consistent sampling before drawing conclusions.
- API vs. live UX differences: API responses may not mirror what users see in the actual interface. Document this gap and run live-session spot checks.
- Personalization: Logged-in sessions and location signals affect responses. Always test from a standardized, logged-out, US-based session.
- Sampling bias: A prompt basket skewed toward branded queries will inflate Mention Rate. Balance the basket deliberately.
- Engine-specific behavior: With only 11% average overlap in cited domains across engines, a single-engine strategy is brittle. Cover at least three engines.
- Regulatory and brand risk: Any accuracy finding that touches product claims, pricing, or regulated categories should route through brand and legal review before public response.
Composite scoring: a spreadsheet-ready formula and sample calculation
A composite AI Visibility Score blends the six metrics into a single index for leadership reporting, while the underlying metrics stay visible for diagnosis.
Formula:
AI Visibility Score = (Brand Mention Rate × 0.15) + (Recommendation Share × 0.30) + (Source Citation Rate × 0.20) + (Accuracy Rate × 0.20) + (Query Coverage Rate × 0.10) + (Cross-Platform Consistency Rate × 0.05)
Weights are configurable. Early-stage brands should weight Query Coverage Rate higher (0.20) and Recommendation Share lower (0.20) because broad presence matters more than winning recommendations you are not yet in. Category leaders should flip those weights.
Sample calculation using the worked example above: (0.60 × 0.15) + (0.30 × 0.30) + (0.20 × 0.20) + (0.90 × 0.20) + (0.70 × 0.10) + (1.00 × 0.05) = 0.09 + 0.09 + 0.04 + 0.18 + 0.07 + 0.05 = 0.52, or 52 out of 100 — Developing band. Paste this formula directly into Google Sheets with your metric values in cells B2:B7 and weights in C2:C7, then use SUMPRODUCT(B2:B7, C2:C7).
Composite scores are useful for executive communication, but they can mask specific problems. Always present the composite alongside the six underlying metrics.
How Authoritylayer operationalizes this framework
Authoritylayer's AI visibility intelligence platform maps directly to the six-metric framework:
- Multi-engine sampling across ChatGPT, Gemini, Perplexity, and Claude
- Prompt management with branded, category, and use-case query tracking
- Citation tracking that identifies which sources AI assistants pull from in your category
- Accuracy review workflow with human-review flagging for disputed classifications
- Recommendation-share scoring and LCRS trend lines over time
- Executive scorecards ready to present to leadership without manual assembly
Teams using Authoritylayer skip the spreadsheet-and-incognito-window phase and move directly to trend analysis and prioritized fixes. The methodology behind the platform follows the same prompt-set, multi-engine, human-review approach described in this guide.
GEO versus traditional SEO: a perspective for CMOs
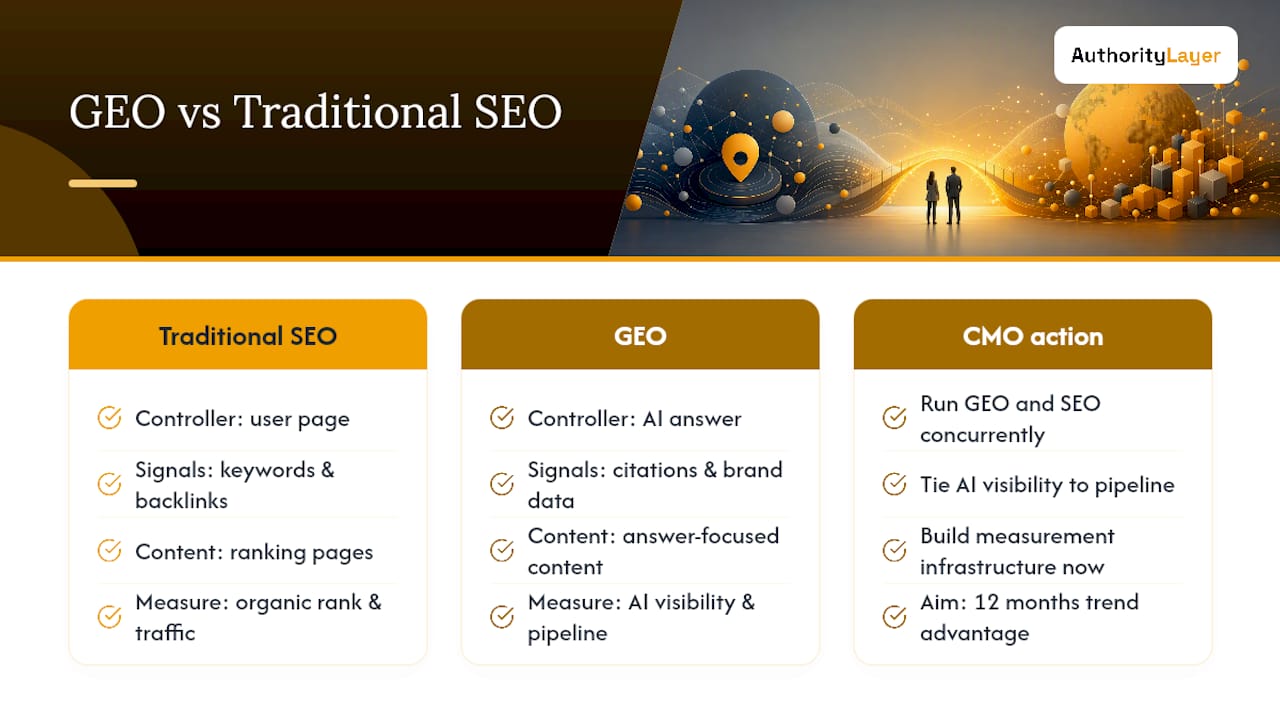
The framing I keep pushing back on is the idea that GEO is just SEO with a new name. It is not. Traditional SEO is a competition for position on a page the user controls. GEO is a competition for inclusion in an answer the AI controls, and the AI's selection criteria are fundamentally different from Google's ranking algorithm.
What actually moves the needle in GEO is being cited by credible third-party sources, having accurate and consistent brand information across the web, and owning content that directly answers the questions buyers ask AI assistants. Keyword density and backlink volume matter far less than they did. What matters is whether Perplexity's retrieval layer finds your content citable and whether ChatGPT's training data includes accurate descriptions of what you do.
The practical advice for CMOs: do not wait for GEO to replace SEO before you start measuring. Run both programs in parallel, tie your AI visibility metrics to pipeline data the same way Adobe recommends linking citation signals to downstream referral traffic, and treat AI visibility as a growth channel with its own OKRs. The teams that build measurement infrastructure now will have 12 months of trend data when their competitors are still running their first pilot.
Your AI visibility baseline is one pilot away
Authoritylayer gives marketing leaders a faster path from zero to a defensible AI visibility scorecard. Instead of building a manual prompt-and-spreadsheet operation, you get multi-engine sampling across ChatGPT, Gemini, Perplexity, and Claude, a six-metric dashboard, and prioritized recommendations, all in one platform.
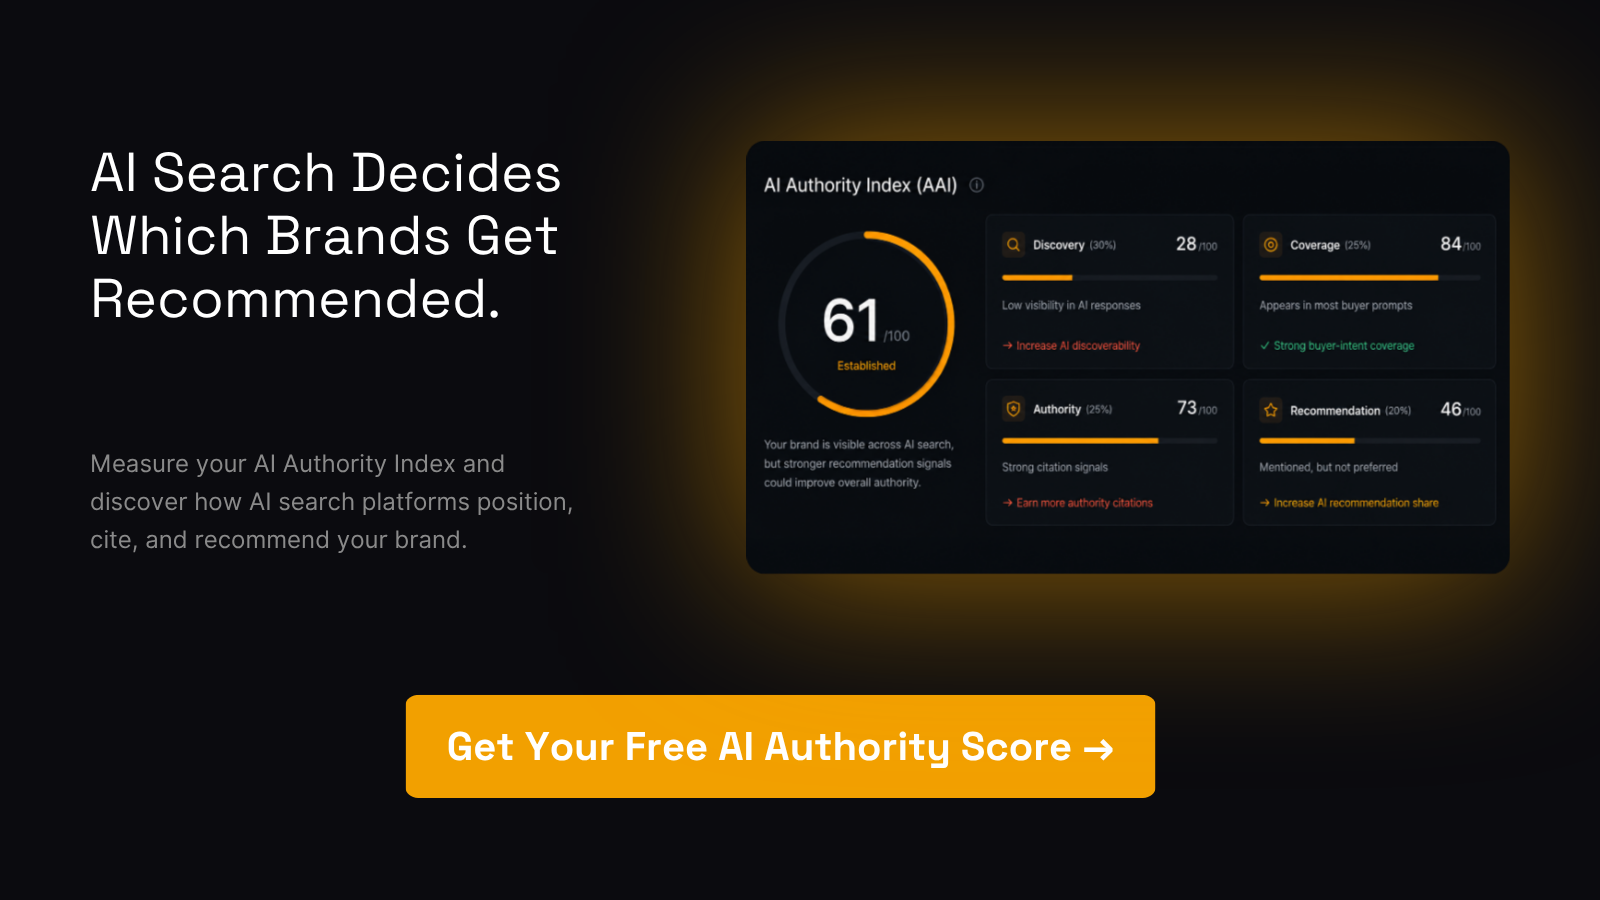
The free AI visibility scan runs your brand against the six metrics described in this guide and returns a baseline scorecard you can present to leadership. No setup required. If you are ready to scale beyond the pilot, the Authoritylayer platform supports ongoing tracking, competitive benchmarking, and executive reporting across your full query set.
Recommended reading
- AI Visibility Metrics: Six KPIs Communications Teams Should Track — 5WPR
- LLM consistency and recommendation share: an SEO KPI for the LLM era — Search Engine Land
- Improve brand visibility in AI search engines — Adobe Business Blog
- AI Answer Visibility Tracking: Tools, Metrics, Protocols — CrawlSense
- AI Evaluation Metrics Checklist for Developers — DataTool Blog
- Authoritylayer AI Visibility Intelligence Platform
Sources
- Improve brand visibility in AI search engines
- AI Visibility Metrics: Six KPIs Communications Teams Should Track
- AI Answer Visibility Tracking: Tools, Metrics, Protocols · CrawlSense Blog
FAQ
What is an LLM evaluation framework for marketing teams?
For marketing leaders, an LLM evaluation framework is a structured measurement system that tracks whether AI assistants mention, cite, and recommend a brand across platforms like ChatGPT, Gemini, and Perplexity. It is distinct from ML benchmarking, which tests model capability rather than brand visibility.
How many prompts do you need for a reliable AI visibility baseline?
A 50-prompt basket run across three engines produces 150 responses, which is enough for a directional baseline. For trend reliability, CrawlSense recommends a 12-week trailing window with consistent weekly sampling on live-retrieval engines.
What is LCRS and why does it matter?
LCRS stands for LLM consistency and recommendation share. It combines how reliably your brand appears across repeated runs and platforms with how often it is the named recommendation, making it the most direct measure of competitive AI visibility.
Why does cross-engine coverage matter so much?
Single-engine measurement produces a misleading picture of actual AI visibility.
How does Authoritylayer support this measurement framework?
Authoritylayer automates multi-engine sampling, prompt management, citation tracking, and accuracy review across ChatGPT, Gemini, Perplexity, and Claude, then delivers the six-metric scorecard and LCRS trend lines in an executive-ready dashboard.