Brand Knowledge Graph: A Practical Guide for Marketing Leaders
Unlock your brand's potential with a knowledge graph. Build a structured model for AI and search engines to understand your identity effectively.
· 20 min read

A brand knowledge graph is your organization's authoritative, machine-readable model of the entities, relationships, attributes, and evidence that define how AI systems and search engines understand your brand. Prose descriptions live in marketing copy; structured facts live in a graph. AI assistants and search engines consume the latter, not the former.
Three things to do this week:
- Pick one canonical entity — your Organization node — and confirm it has a single, consistent name, URL, and description across every system you own.
- Add a minimal JSON-LD block using Schema Organization markup to your homepage so search engines and AI crawlers can read it immediately.
- Assign one owner — a person, not a team — who is accountable for keeping that entity accurate.
Gartner forecasts that traditional search engine volume will drop 25% by 2026 as AI chatbots and virtual agents absorb more queries. That shift means the machine-readable facts you publish now determine whether AI systems describe your brand accurately or invent something plausible.
Key Takeaways
A brand knowledge graph is the most direct lever marketing leaders have for controlling how AI assistants describe, cite, and recommend their brand across every surface that matters.
| Point | Details |
|---|---|
| Start with one entity | Scope your first graph to a single product line or Organization node to ship fast and learn quickly. |
| Provenance is non-negotiable | Every claim in the graph needs a source link; AI systems favor verifiable evidence over unsourced assertions. |
| Governance before scaling | Assign one Graph Owner and define canonical sources before expanding beyond your pilot scope. |
| Measure on eight surfaces | Track citation rate, recommendation share, and cross-engine consistency across search engines and AI assistants simultaneously. |
| Authoritylayer for monitoring | Authoritylayer's multi-surface AI visibility monitoring connects graph changes to measurable citation and recommendation outcomes. |
Table of Contents
- What is a brand knowledge graph?
- Why brand knowledge graphs matter for AI search visibility
- Core components and data model of a brand knowledge graph
- How to build a minimum viable brand knowledge graph
- Where structured data and linked data fit into the graph
- Governance, ownership, and scaling across teams
- How to measure success: KPIs and signals for AI visibility
- Common challenges and practical mitigation tactics
- A short example: before and after a minimal graph pilot
- Measuring AI visibility and knowledge-graph impact
- Integration with existing brand and marketing systems
- How a brand leader should start this in month 1
- Authoritylayer: AI visibility monitoring for brand knowledge graph teams
- Sources
- FAQ
What is a brand knowledge graph?
A knowledge graph represents information as a network of nodes (entities) and edges (relationships). For a brand, that means your company, products, people, locations, certifications, and claims each become a node, and the connections between them — "Product A is made by Organization B," "Person C leads Team D" — become edges with typed, queryable relationships.
The minimal vocabulary you need:
- Entity: a discrete, named thing — your company, a product line, a founder, a market certification.
- Relationship/edge: a typed connection between two entities ("manufactures," "employs," "certifies").
- Attribute: a property of an entity — a founding year, a canonical URL, a product SKU.
- Canonical ID: the single authoritative identifier for an entity, used consistently across every system.
- Provenance: the source and timestamp attached to a claim, so any system consuming the graph knows where the fact came from and when it was verified.
Here is what a tiny slice of a brand graph looks like in conceptual terms:
Organization node: Name = "Acme Corp" | URL = "https://acme.com" | Founded = 2010 | Canonical ID = "acme-corp-001" Product node: Name = "Acme Pro" | SKU = "AP-100" | Launch year = 2022 | Canonical ID = "acme-pro-001" Edge: Acme Corp → manufactures → Acme Pro | Provenance = internal product registry | Verified = March 2026
That three-node fragment is enough for a search engine or AI assistant to answer "Who makes Acme Pro?" with a sourced, verifiable fact rather than a guess. BrandMythos demonstrates how even this minimal JSON-LD pattern — modeling Organization, values, voice contexts, and product relationships — produces explicit, queryable answers that prose alone cannot.
Why brand knowledge graphs matter for AI search visibility
AI assistants do not read your website the way a human does. They extract structured signals, reconcile them across sources, and synthesize an answer. When your brand facts are scattered across inconsistent press releases, product pages with conflicting specs, and a LinkedIn profile that disagrees with your homepage, the model picks whichever version appears most frequently or most authoritatively sourced. That is rarely the version you want.
A well-structured brand knowledge graph reduces that ambiguity by giving AI systems a single, verifiable source of truth. The practical outcomes:
- Higher citation rates in AI overviews: AI assistants favor sources that present structured, verifiable claims. When your facts are machine-readable and linked to evidence, they are easier to cite.
- Consistent knowledge panels: Google's Knowledge Panel draws from its Knowledge Graph, which is populated partly by schema.org markup you publish. Consistent structured data reduces the chance of the panel showing a wrong founding date or an outdated description.
- Fewer contradictory claims across channels: A canonical graph forces reconciliation. When your CRM, your website, and your press kit all point to the same entity IDs, the contradictions that confuse AI systems disappear.
- Better recommendation share: AI assistants that can verify your brand's claims are more likely to recommend you in competitive queries.
Gartner forecasts a significant drop in traditional search engine volume by 2026 due to AI chatbots and virtual agents. For brand leaders, that means the window to establish machine-readable authority is narrowing — not years away, but quarters.
The shift from brand SERP to AI-generated answers is not a future concern. It is already reshaping how buyers discover and evaluate vendors during research. Brands that invest in structured, verifiable facts now will have a compounding advantage as AI assistants become the primary discovery layer.
Core components and data model of a brand knowledge graph
Most brand graphs need eight entity types to cover the facts AI systems ask about most often.
Entity types and their key attributes:
| Entity type | Typical attributes | Why it matters |
|---|---|---|
| Organization | Name, URL, founding year, HQ location, canonical ID | Root node; everything else connects here |
| Product / Service | Name, SKU, launch year, category, canonical URL | Enables product-level citations in AI answers |
| Location | Address, region, geo-coordinates, canonical ID | Supports local search and multi-market queries |
| Person | Name, role, canonical ID, linked profiles | Connects leadership and expertise claims |
| Certification | Issuing body, certificate ID, expiry date, evidence URL | Verifiable trust signals for regulated industries |
| Case study / Proof | Client type, outcome metric, date, evidence link | Grounds performance claims in verifiable evidence |
| Claim | Statement text, claim type, source entity, date | Explicit representation of brand assertions |
| Proof / Evidence | Source URL, document type, verification date | Provenance layer that makes claims trustworthy |
Ontology and provenance checklist:
For each entity, confirm you have: a canonical ID that never changes, a canonical URL that resolves, at least one provenance link (an internal system of record or a public document), and a last-verified timestamp. Without provenance, a claim is an assertion. With it, it is evidence.
How to build a minimum viable brand knowledge graph
Start narrow. A graph that covers one product line with five to ten core attributes and two or three voice contexts ships faster and teaches you more than a sprawling enterprise model that never launches. Adobe's guidance on the identify-model-align sequence is the right mental model here: identify your entities first, then model their relationships, then align your site pages to expose them.
- Scope selection: Choose one product line or flagship service. Define the boundary explicitly — what is in scope and what is not. Resist the urge to model everything.
- Entity inventory: List every entity within scope. For a product line, that typically means the Organization node, three to five Product nodes, one or two Person nodes (product leads), and any relevant Certification nodes.
- Assign canonical IDs: Give each entity a stable, internal identifier that will not change when a product is renamed or a URL is restructured. A simple slug format ("acme-pro-001") works fine at this stage.
- Map your sources: For each entity and attribute, identify the system of record — your PIM, your CRM, your legal entity registry. This becomes your provenance map.
- Model the schema: Map each entity to its schema.org type. Organization, Product, Person, and LocalBusiness cover most brand entities. Note the attributes each type supports.
- Plan ingestion: Decide how graph data flows from source systems to your publishing layer. Even a spreadsheet-to-JSON-LD pipeline is a valid starting point.
- Publish JSON-LD on-site: Add structured data blocks to the pages that represent each entity. Your homepage carries the Organization block; product pages carry Product blocks.
- Validate and test: Use Google's Rich Results Test and schema.org's validator to confirm your markup is error-free. Then run a multi-surface AI visibility scan to establish a baseline before you make further changes.
- Set up monitoring: Track citation rates and knowledge panel accuracy weekly. Changes in AI-generated answers often lag graph updates by two to four weeks, so patience matters here.
Pro Tip: *Extract entities from documents you already own — product specs, legal filings, press releases — rather than building from scratch.
Where structured data and linked data fit into the graph
JSON-LD and schema.org are the public-facing layer of your brand knowledge graph, not the graph itself. The graph is your internal model; JSON-LD is how you expose fragments of it to search engines and AI crawlers.
The mapping logic is straightforward: every internal entity gets a schema.org type, every attribute gets a schema.org property, and every page that represents an entity gets a JSON-LD block. A minimal Organization block on your homepage tells Google's Knowledge Graph your canonical name, URL, founding date, and social profiles. A Product block on a product page tells it the SKU, description, and brand relationship.
Mapping checklist:
- Internal entity → schema.org type (Organization, Product, Person, LocalBusiness, Certification)
- Canonical ID →
@idproperty (use a full URL, not a slug) - Canonical URL →
urlproperty - Provenance source →
subjectOfor a custom property in your internal graph - Page or endpoint → where the JSON-LD block lives
Internal-only representations — the full graph with provenance chains, relationship weights, and evidence links — stay behind your API. You publish only the facts you want AI systems and search engines to consume publicly.
Pro Tip: The single most common JSON-LD mistake is inconsistent @id values. If your Organization node uses "https://acme.com" on the homepage and "https://www.acme.com" on the about page, search engines treat them as two different entities. Pick one canonical URL and use it everywhere, including in your internal graph.
The Google Knowledge Graph draws from schema.org markup, Wikidata, and other structured sources. Publishing consistent JSON-LD is the most direct lever you control for influencing what it knows about your brand.
Governance, ownership, and scaling across teams
A brand knowledge graph without governance degrades within months. Product names change, certifications expire, people leave, and nobody updates the graph. The solution is not a bigger team — it is a clear ownership model with defined update cadences.
Recommended ownership model:
- Graph Owner (one person, usually a Head of Brand or Marketing Ops lead): accountable for the graph's accuracy and strategic scope. Has final say on canonical IDs and entity definitions.
- Domain Stewards (one per business unit or product line): responsible for keeping their entities current. They submit changes; the Graph Owner approves structural changes.
- Contributors (product managers, legal, HR): provide source data from their systems of record. They do not edit the graph directly.
Governance checklist:
- Canonical sources documented for every entity type (which system of record wins in a conflict)
- Update cadence defined: product entities reviewed quarterly, certification entities reviewed on expiry, Organization node reviewed annually or after any major change
- Evidence validation process: every new claim requires a provenance link before it enters the graph
- Access controls: contributors can propose, stewards can update attributes, owners can add or retire entities
- Audit trail: every change logged with who made it, when, and what the previous value was
Scaling from one product line to enterprise coverage follows the same pattern. Protocol Lumenario's decision guide frames the central-graph-versus-distributed-structured-data trade-off well: a central graph gives you consistency and a single query layer; distributed JSON-LD across sites gives you speed and autonomy. Most organizations land on a hybrid — a central graph that feeds distributed JSON-LD publishing through an API or a content management integration.
Schema drift is the main scaling risk. When domain stewards add attributes without coordinating with the Graph Owner, you end up with three different ways to represent "product category" across business units. A shared ontology document, reviewed quarterly, prevents most of it.
How to measure success: KPIs and signals for AI visibility
Measurement connects graph quality to business outcomes. Without it, you cannot tell whether a schema update improved your citation rate or whether a competitor's new content eroded your recommendation share.
Multi-surface monitoring across at least four search engines and four AI assistants is the baseline. Tracking only Google misses the independent opinions that ChatGPT, Gemini, Claude, and Perplexity form from different training data and retrieval patterns.
Core KPIs:
Measurement playbook:
- Establish a baseline before any graph change goes live.
- Use a phased rollout: publish structured data for one entity type, wait three to four weeks, then measure citation rate changes before expanding.
- Brand presence in AI answers decomposes into four separate signals — mention, citation, linked source, and recommendation. Track all four independently; a brand can be mentioned frequently but rarely recommended, which points to a trust or evidence gap rather than a visibility gap.
- Report to executives on citation rate and recommendation share. These translate directly to pipeline influence in a way that "impressions" no longer do.
Common challenges and practical mitigation tactics
Most brand knowledge graph projects stall at the same predictable points. Knowing them in advance cuts months off your timeline.
- Data silos: Product data lives in the PIM, customer data in the CRM, location data in a spreadsheet someone owns. Mitigation: map your sources before you model your schema. The provenance map from the build checklist doubles as your silo inventory.
- Inconsistent canonical IDs: Different teams use different identifiers for the same product. Mitigation: assign canonical IDs in a single session with all domain stewards present, then lock them in a shared registry.
- Weak provenance: Claims enter the graph without evidence links. Mitigation: make provenance a required field in your ingestion pipeline. No link, no entry.
- Lack of ownership: The graph is everyone's responsibility and therefore no one's. Mitigation: name one Graph Owner before the project starts, not after the first governance crisis.
- Publication gaps: The internal graph is accurate but JSON-LD on the site is six months behind. Mitigation: automate the publishing step. Even a weekly export from your graph to a JSON-LD template reduces lag dramatically.
Security and privacy:
- Never include PII in public-facing JSON-LD. Person nodes for public figures (executives, named authors) are fine; internal employee data is not.
- Apply access controls at the graph layer, not just the publishing layer. A contributor who can read the full graph can inadvertently expose unpublished product roadmap data.
- Version every graph state so you can roll back a change that introduces an error or exposes data it should not.
Start with a pilot scoped to one product line. Get one governance cycle completed — one quarterly review, one evidence validation pass — before expanding. The patterns you establish in the pilot become the template for every subsequent business unit.
A short example: before and after a minimal graph pilot
A mid-size B2B software company noticed that AI assistants were describing their flagship product inconsistently — sometimes citing an outdated pricing model, sometimes attributing features to a competitor's product with a similar name.
What they modeled: One Organization node, three Product nodes, two Person nodes (CEO and Head of Product), and four Certification nodes. Total: ten entities, roughly forty attributes, all with provenance links to their product registry and legal entity filings.
What they published: JSON-LD blocks on the homepage (Organization), three product pages (Product), and the About page (Person). Total implementation time: one sprint.
What changed: Within six weeks, their AI overview citation rate on product-specific queries increased, and the inconsistent feature attributions disappeared from ChatGPT and Perplexity responses. Their Google Knowledge Panel updated to reflect the correct founding year and headquarters location within four weeks of the JSON-LD going live.
The fastest win was the Organization node. Publishing a single, consistent JSON-LD block with a canonical
@idresolved three conflicting descriptions that had persisted across AI assistants for over a year. The fix took two hours to implement and four weeks to propagate.
The lesson: scope matters more than sophistication. Ten well-governed entities with clean provenance outperform a hundred loosely modeled ones every time.
Measuring AI visibility and knowledge-graph impact
Connecting graph changes to AI visibility outcomes requires a repeatable workflow, not a one-time audit. The Authoritylayer methodology frames this as a continuous loop: publish a graph change, run a multi-surface visibility scan, compare citation rates and linked-source ratios before and after, then iterate.
Workflow checklist:
- Feed graph changes into your publishing pipeline and log the deployment date.
- Run a full multi-surface scan within 48 hours of deployment to capture the pre-propagation baseline.
- Re-scan at two weeks and four weeks to capture propagation effects.
- Compare citation rate, linked-source ratio, and cross-engine consistency against the pre-change baseline.
- Flag any surface where consistency drops below 80% for immediate investigation.
Executive dashboard metrics — the three numbers that matter to a CMO:
- AI citation rate: how often your brand appears in AI-generated answers for your tracked queries.
- Recommendation share: of the queries where your brand is cited, what percentage include a recommendation rather than just a mention.
- Cross-engine consistency: do ChatGPT, Gemini, Claude, and Perplexity agree on your core brand facts?
Authoritylayer's AI visibility reports track all three across eight surfaces simultaneously, which is the minimum coverage needed to catch the divergences that single-engine monitoring misses.
Integration with existing brand and marketing systems
A brand knowledge graph does not replace your existing systems. It connects them. Your PIM is still the system of record for product attributes; your CRM still owns customer relationships; your DAM still manages brand assets. The graph sits above them as a reconciliation and publishing layer.
Practical integration patterns:
- PIM to graph: export product entities on a scheduled basis (weekly or on change events) and map them to your Product nodes. The PIM's SKU becomes the canonical ID.
- CRM to graph: for B2B brands, key account relationships and named customer case studies can become Case Study nodes with provenance links to contract records (anonymized as needed).
- DAM to graph: brand asset metadata — logo versions, color codes, usage rules — maps naturally to an Organization node's brand attributes. This is particularly useful for ensuring AI systems cite the correct visual identity.
- CMS to graph: your content management system is the publishing layer for JSON-LD. Most modern CMS platforms support structured data plugins or custom field mappings that can auto-generate JSON-LD from graph data.
Knowledge management practices that treat brand knowledge as a governed, structured asset — rather than a collection of documents — make this integration significantly easier. Teams that have already centralized their brand guidelines and product documentation have most of the raw material for a graph; the work is structuring and linking it, not creating it from scratch.
For analytics integration, connect your AI visibility metrics to your existing marketing analytics stack. AI-driven referral traffic, tracked as a separate channel in your analytics platform, gives you a direct line from graph quality to pipeline contribution.
How a brand leader should start this in month 1
The first month is about proving the concept, not building the system. Here is how to spend it.
Week 1: Audit your current brand facts across three surfaces — your homepage, your Google Knowledge Panel, and one AI assistant of your choice. Note every inconsistency. This audit is your baseline and your business case.
Week 2: Convene a two-hour session with your marketing ops lead, one product manager, and whoever owns your website. Agree on canonical names, URLs, and founding facts for your Organization node. Document them in a shared spreadsheet. That spreadsheet is your first graph.
Week 3: Publish JSON-LD for your Organization node on your homepage. Use schema.org's Organization type. Validate with Google's Rich Results Test. This is your first graph publication.
Week 4: Assign a Graph Owner formally. Set a calendar reminder for a 30-day check-in. Run a multi-surface AI visibility scan to establish your post-publication baseline.
Signals to watch in weeks 1 through 8:
- Knowledge Panel accuracy (does it now reflect your canonical data?)
- AI assistant descriptions of your brand on at least two surfaces
- Any change in AI-driven referral traffic in your analytics
The AI visibility scan from Authoritylayer gives you a starting read on all three without manual query testing across eight surfaces. Use it at week 1 and again at week 8 to measure progress.
Stakeholder alignment is the real work of month 1. The technical steps are straightforward; getting legal, product, and marketing to agree on canonical facts is where projects stall. Frame the conversation around risk — inconsistent brand facts in AI answers are a brand integrity issue, not just an SEO issue — and you will get faster sign-off.
Authoritylayer: AI visibility monitoring for brand knowledge graph teams
Once your graph is live, the question shifts from "did we publish it?" to "is it working?" That is where most teams hit a wall. Manual query testing across ChatGPT, Gemini, Claude, Perplexity, Google, and Bing is slow, inconsistent, and impossible to scale.
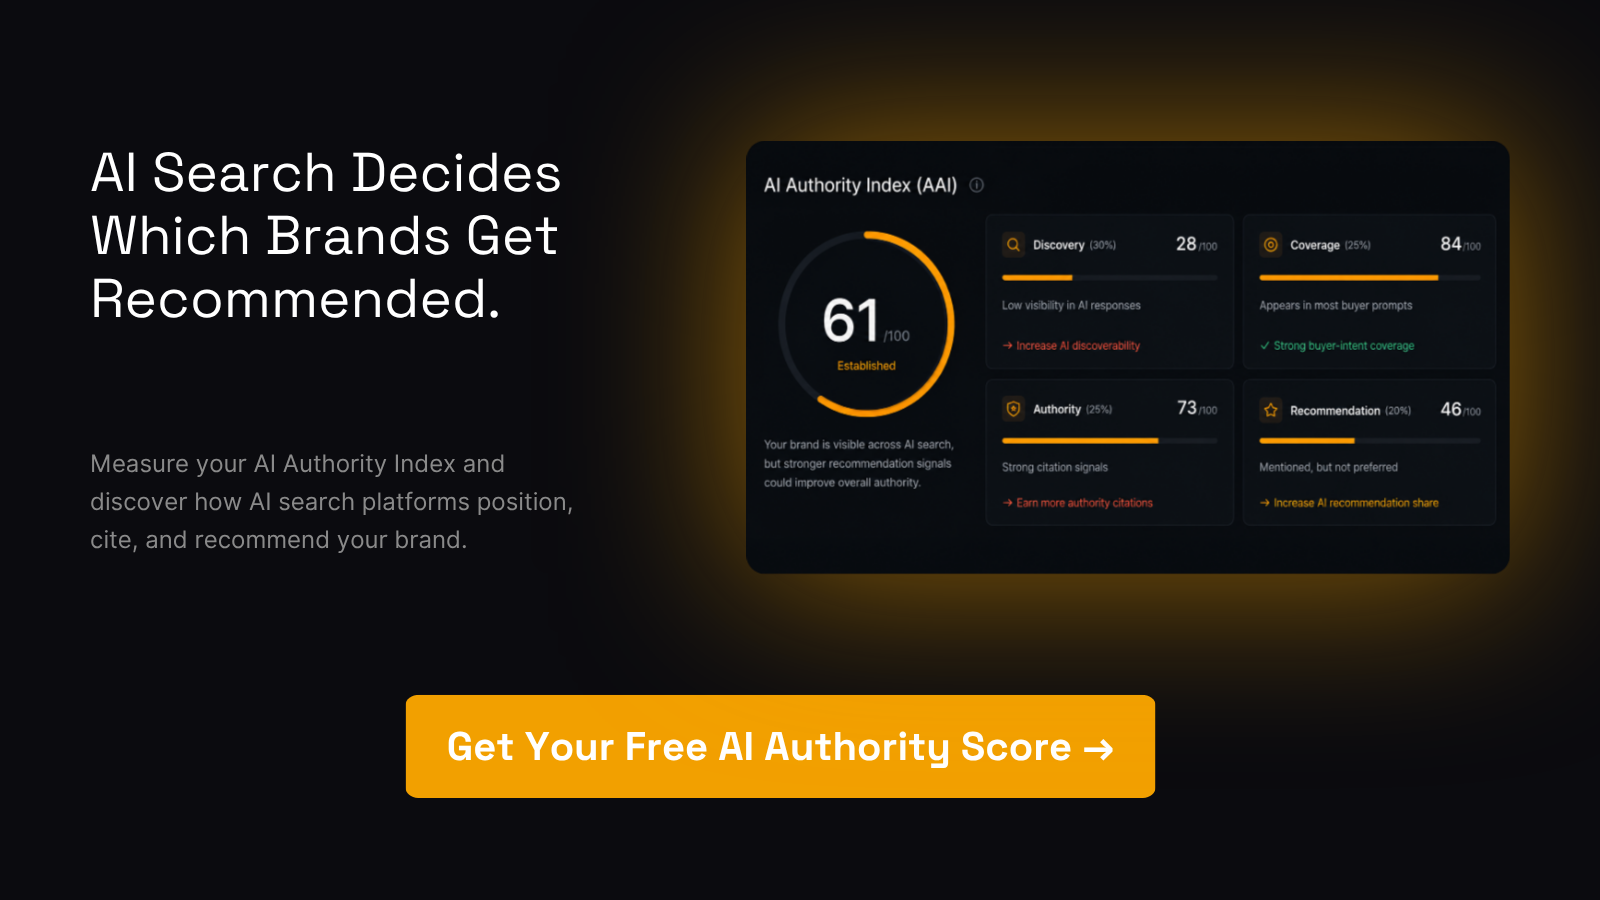
Authoritylayer is built for exactly this stage. It monitors your brand's citation rate, recommendation share, and cross-engine consistency across eight surfaces simultaneously, then surfaces the gaps with prioritized recommendations so your team knows what to fix next. You get the AI Authority Index score, competitive benchmarking against your category, and a prompt-tracking layer that shows which queries are driving AI-generated mentions of your brand and which are sending buyers to competitors.
For teams running a brand knowledge graph pilot, the free AI visibility scan gives you a before-and-after baseline in minutes. For teams ready to monitor continuously, Authoritylayer's Growth plan covers the full eight-surface monitoring stack with weekly reporting built in.
Sources
- Gartner press release: search-volume prediction
- Building a Knowledge Graph for AI Brand Visibility — Adobe Business
- How to Create a Brand Knowledge Graph for AI | BrandMythos
FAQ
What is a brand knowledge graph?
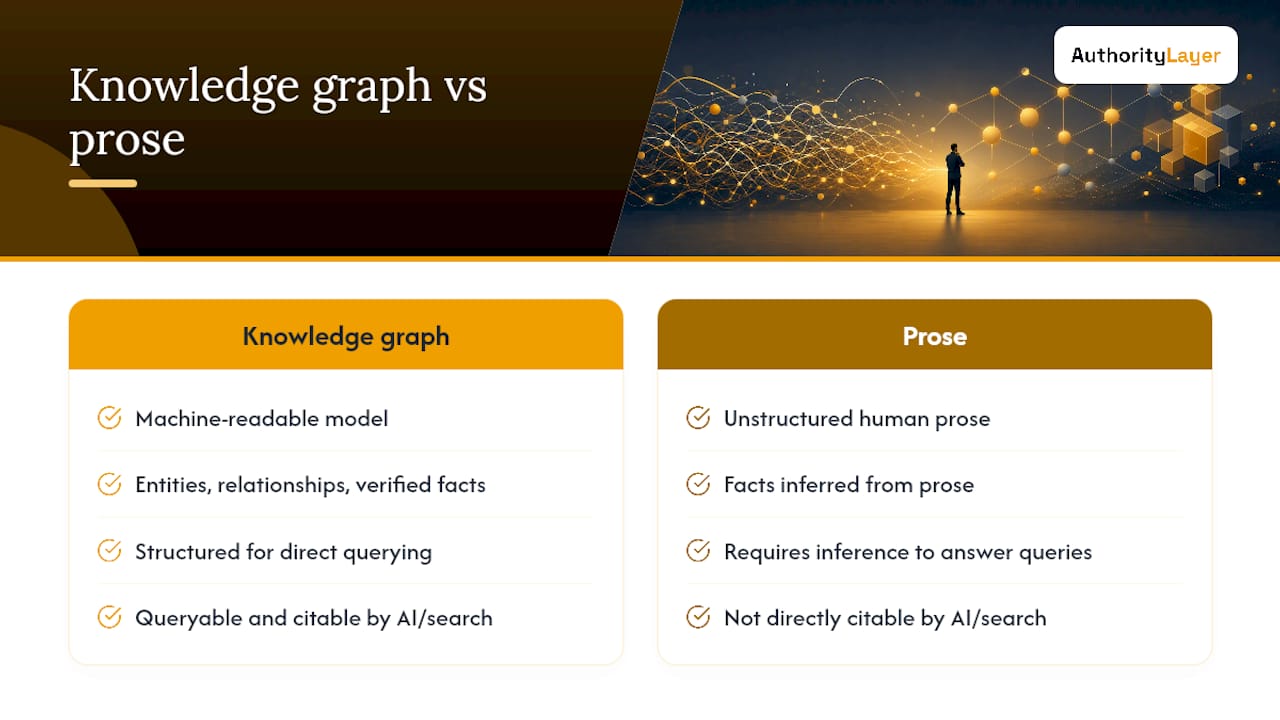
A brand knowledge graph is a machine-readable model of the entities, relationships, and verified facts that define your brand — structured so AI systems and search engines can query and cite them directly, rather than inferring them from prose.
Does Google still use the Knowledge Graph?
Yes. Google's Knowledge Graph remains active and continues to power Knowledge Panels, featured snippets, and entity-based search features. Schema.org JSON-LD markup published on your site is one of the most direct ways to influence what it knows about your brand.
Can you give an example of a knowledge graph?
A minimal brand example: an Organization node ("Acme Corp," founded 2010, canonical URL "https://acme.com") connected by a "manufactures" edge to a Product node ("Acme Pro," SKU "AP-100," launched 2022), with a provenance link to the internal product registry. That three-node structure is enough for an AI assistant to answer product-origin queries with a sourced fact.
What is the best knowledge graph approach for a brand starting out?
Start with a single Organization node and three to five Product nodes, publish them as JSON-LD using schema.org types, and assign one owner before expanding. The BrandMythos and Adobe guides linked above are the most practical starting points for the modeling work.

How do you measure whether a brand knowledge graph is improving AI visibility?
Track four signals independently: mention rate, citation rate, linked-source ratio, and recommendation share across at least four AI assistants and four search engines. A baseline scan before any graph change goes live, followed by re-scans at two and four weeks, gives you a clean before-and-after comparison.
Recommended
- Knowledge Base for AI: What Marketing Leaders Need in 2026 | AuthorityLayer Insights
- Insights — AI Visibility Intelligence Reports | AuthorityLayer
- Generative Engine Optimization: Practical GEO Playbook | AuthorityLayer Insights
- AI Trust Signals: The Brand Leader's Complete Guide | AuthorityLayer Insights