Marketing Leaders: Measure AI Visibility by Market and Model
Stop averaging one AI visibility score. Learn practical steps and metrics—recommendation share, mention rate, source quality—and dashboards to measure by...
· 12 min read

You don't have one AI visibility score. Your brand has many, one per market and model, and averaging them into a single number hides the differences that actually drive decisions. Recent audits from arXiv and evaluations like ChoiceEval confirm the pattern: model, language, and location each shift what an AI assistant recommends. Platforms like AuthorityLayer report the split instead of one blended figure. Stop publishing a single score and start reporting distributions.
TL;DR:
- A single AI visibility score obscures regional, language, and model biases that significantly influence brand recommendations and should be reported as distributions.
- Different factors such as language choice, model version, exit IP, and run-to-run instability independently affect AI recommendation results and require separate measurement.
- Conducting multiple language and model tests, capturing recommendation share and stability metrics, provides a clearer picture of actual brand visibility gaps across markets.
- Regular audits should include repeated prompts and confidence intervals to account for response variability and distinguish persistent issues from random fluctuations.
- Prioritizing granular, market-specific data over aggregated scores enables targeted improvements and more accurate assessment of brand presence in AI assistant responses.
Table of Contents
- Why one blended score hides the real story
- What the research says about market and model level scoring
- How to measure AI visibility per market
- Dashboard metrics that show what a blended score cannot
- Reading per-market scores without misreading them
- How AuthorityLayer builds per-market scores into a single view
- What the research actually tells marketing leaders to do differently
- Turning per-market scores into a plan with AuthorityLayer
- Sources
- FAQ
Why one blended score hides the real story
A single AI visibility number is an average of things that do not behave the same way. Language often decides whether a local supplier ever gets named, so an English-only audit can miss a brand that dominates in its home language and looks invisible everywhere else. Models carry structured preferences shaped by their training data, and the geographic bias research from arXiv found correlations as high as Spearman's ρ = 0.89 for geographic predictions, with the strongest effects showing up on subjective topics tied to socioeconomic status. That is not noise. That is a pattern baked into how the model was trained.
Exit IP adds another variable entirely separate from language. A prompt run from a Berlin IP address in English does not necessarily produce the same market context as the identical prompt run from a Chicago IP address, because the assistant may quietly assume a different country of purchase. Layer on instability, since repeated identical prompts do not always return the same top recommendation, and a single-run snapshot becomes almost meaningless.
The practical result is that four separate forces move your score independently:
- Language gates which local suppliers even enter the recommendation set.
- Model carries its own trained-in preferences and geographic tilt.
- Exit IP changes the assumed market without changing the query itself.
- Run-to-run instability means one snapshot can look strong or weak by chance.
Collapsing all four into one number tells you that something is happening, never what or where. A market-level, model-level view tells you which lever to pull.
What the research says about market and model level scoring
The case for granular measurement is not theoretical. It comes from a cluster of recent studies that each isolate a different variable and find the same conclusion: a blended score cannot distinguish a real gap from a measurement artifact.
The geographic bias paper on arXiv documented bias effects up to 0.70 against lower-socioeconomic locations on subjective questions, and showed those effects vary by model rather than applying uniformly. A ChoiceEval-style audit of brand and culture preferences tested more than 2,000 questions across Gemini, GPT, and DeepSeek and found systematic country-of-origin favoritism, with some models tilting toward American entities more than others. That means a raw mention count without competitor and origin context will overstate or understate a brand's real position depending on which model you happened to query.
Query language changes outcomes more than it changes wording. A twelve-language European study built on 35,640 grounded responses found that switching a query from English into a brand's home language raised recommendation share substantially more for local champions than for global multinationals. Local brands that look weak in an English-only audit can be dominant once you ask in their home market's language.
The same study found that model choice, not language, explained most of the instability in responses: model accounted for far more variance in response stability than language did. A related study on query language and exit IP confirmed the two act as separable factors, with language determining whether local suppliers get named and exit IP determining which national market the assistant assumes.
Together these findings point to one measurement takeaway: audit across multiple languages and multiple models, and report the resulting spread rather than a single average.

How to measure AI visibility per market
Turning that research into a repeatable process takes discipline, not new technology. The steps below outline the baseline audit most marketing teams can run internally or through a platform built for it.
- Define each market as language plus egress plus buyer-intent category, not just as a country name. A "Germany" market is really German-language prompts run from a German or EU exit IP, scoped to a specific buying category such as enterprise software or consumer electronics.
- Choose the models you will test and record their exact versions, testing both API and consumer web interfaces where possible, since the same underlying model can behave differently through each surface.
- Write native buyer prompts in each target language, phrased the way a real buyer in that market would ask, rather than translating an English prompt word for word.
- Run each prompt set in repeated batches, capturing the top-k recommendations in every run so you can compute a recommendation-share distribution instead of a single result.
- Normalize for category and competitor origin before comparing scores across markets, since a category with mostly domestic competitors will naturally read differently than one dominated by multinationals.
- Report results in two layers: a per-model lane showing how each assistant behaves, and an aggregated market view showing the combined distribution with variance bands.
The study on query language and exit IP showed that top recommendations can change across identical repeated runs, which is why a distribution and a confidence interval matter more than any single answer. Testing once and calling it a score is the most common mistake teams make.
Pro Tip: Run at least 20 to 30 repeated prompts per market and model before you trust the resulting share, since smaller samples tend to look artificially stable.
For timeline and cost, a baseline audit covering three or four priority markets across two or three models typically takes a focused team one to two weeks to design, run, and normalize, assuming native-language prompts are already drafted. Refresh cycles matter more than the initial baseline: quarterly re-runs catch model updates and seasonal shifts, while monthly checks suit categories where competitors are actively working on their own AI visibility.
Dashboard metrics that show what a blended score cannot
Once you have per-market, per-model data, the dashboard has to preserve the structure instead of flattening it back into one number. A handful of metrics do most of the work.
- Recommendation share: the percentage of runs in which your brand appears in the top-k results for a given market and model, explained in more detail in AuthorityLayer's recommendation share methodology.
- Mention rate: how often your brand is named at all, even outside the top recommendations, which flags awareness gaps before they become recommendation gaps.
- Source quality index: a measure of whether the sources feeding an assistant's answer are authoritative or thin, since weak sourcing tends to precede unstable scores.
- Sentiment-adjusted share: recommendation share weighted by whether the mention is favorable, neutral, or negative.
Stability metrics matter as much as the headline numbers. Top-k persistence tracks whether your brand stays in the top results across repeated runs, variance shows how much a score swings between runs, and confidence intervals put a defensible range around every figure instead of a false sense of precision. Pew Research found that 58% of search results pages included at least one AI-generated summary, and 93% of people visited a page mentioning AI within a month, which is one reason these assistant-level metrics deserve their own dashboard real estate rather than a footnote.
Keep model and language as separate lanes or filters rather than merging them, since the European language study found model explained far more of the swing in response stability than language did (η² of 0.32 versus 0.01). Visually, that means distribution histograms per market, small multiples so markets sit side by side for quick comparison, and uncertainty bands on every trend line instead of a single point estimate. Set alert thresholds around sustained drops in recommendation share across multiple runs, not single-run dips, and treat any market where confidence intervals overlap heavily between periods as stable rather than declining.
Reading per-market scores without misreading them
Scores are diagnostic signals, not revenue forecasts. A drop in recommendation share tells you an assistant is less likely to surface your brand in a given context, not how many sales that costs you, and treating the two as interchangeable leads to overreacting to normal variance.
The language blind spot is the most common misread. A brand can look weak in English-only audits while holding a strong position in its home-language market, so a low blended score sometimes just means nobody asked the right question in the right language. Model-specific favoritism is the second trap: a high score in one assistant does not guarantee the same result elsewhere, and the ChoiceEval-style audit of country-of-origin preferences is a reminder that some models simply favor certain origins regardless of a brand's actual market strength.
A few rules of thumb keep interpretation honest:
- Confirm before scaling spend: a strong score in one model needs to show up in at least one other model before you commit budget to it.
- Escalate persistence, not single dips: a score that stays low across languages and models over multiple audit cycles is a real gap; a single weak run usually is not.
- Prioritize quick wins first: native-language prompts and stronger local proof sources tend to move scores faster than a full content overhaul.
Pro Tip: Before investing in a new market's AI visibility, run the same audit twice a month apart. If the gap persists both times, it's a real signal worth acting on.
How AuthorityLayer builds per-market scores into a single view
An AI Authority Index can be built market by market rather than as one composite figure, because averaging away language, model, and exit IP differences erases the information marketing teams actually need. Each market lane combines recommendation share, mention rate, source quality, and stability metrics, run across multiple assistants.
Clients typically see the same pattern show up: strong performance in one model or language paired with a near-invisible presence in another, something a blended score would have hidden entirely. The platform surfaces that gap as a prioritized recommendation, pointing to the specific source, prompt pattern, or market where a fix is most likely to move the number.
A market score only means something once you can see the model lanes, the language behind it, and the confidence interval around it.
— Geraldine
What the research actually tells marketing leaders to do differently
Most AI visibility advice still treats the topic as a content problem: publish more, get cited more, watch the number climb. The research says something more specific. Language and model explain more of the variation than content quality alone, which means a team that only optimizes English-language pages for one assistant is solving a fraction of the problem.
The overrated move is chasing a single composite score as if it were a KPI to report upward. It flattens exactly the signal that matters, which is where and why a brand is invisible. The underrated move is running the same audit in a second language before spending another dollar on content, because a home-language gap is often cheaper to close than a global content push.
If you take one thing from this, prioritize measurement granularity over measurement frequency. A quarterly audit across three languages and three models will tell you more than a weekly check on one blended number ever will.
— Geraldine
Turning per-market scores into a plan with AuthorityLayer
AuthorityLayer's Enterprise plan builds the per-market approach described above directly into the platform: multi-model monitoring across ChatGPT, Claude, Gemini, and Perplexity, competitive benchmarking by market and language, and prioritized recommendations tied to the specific gap causing a score to lag.
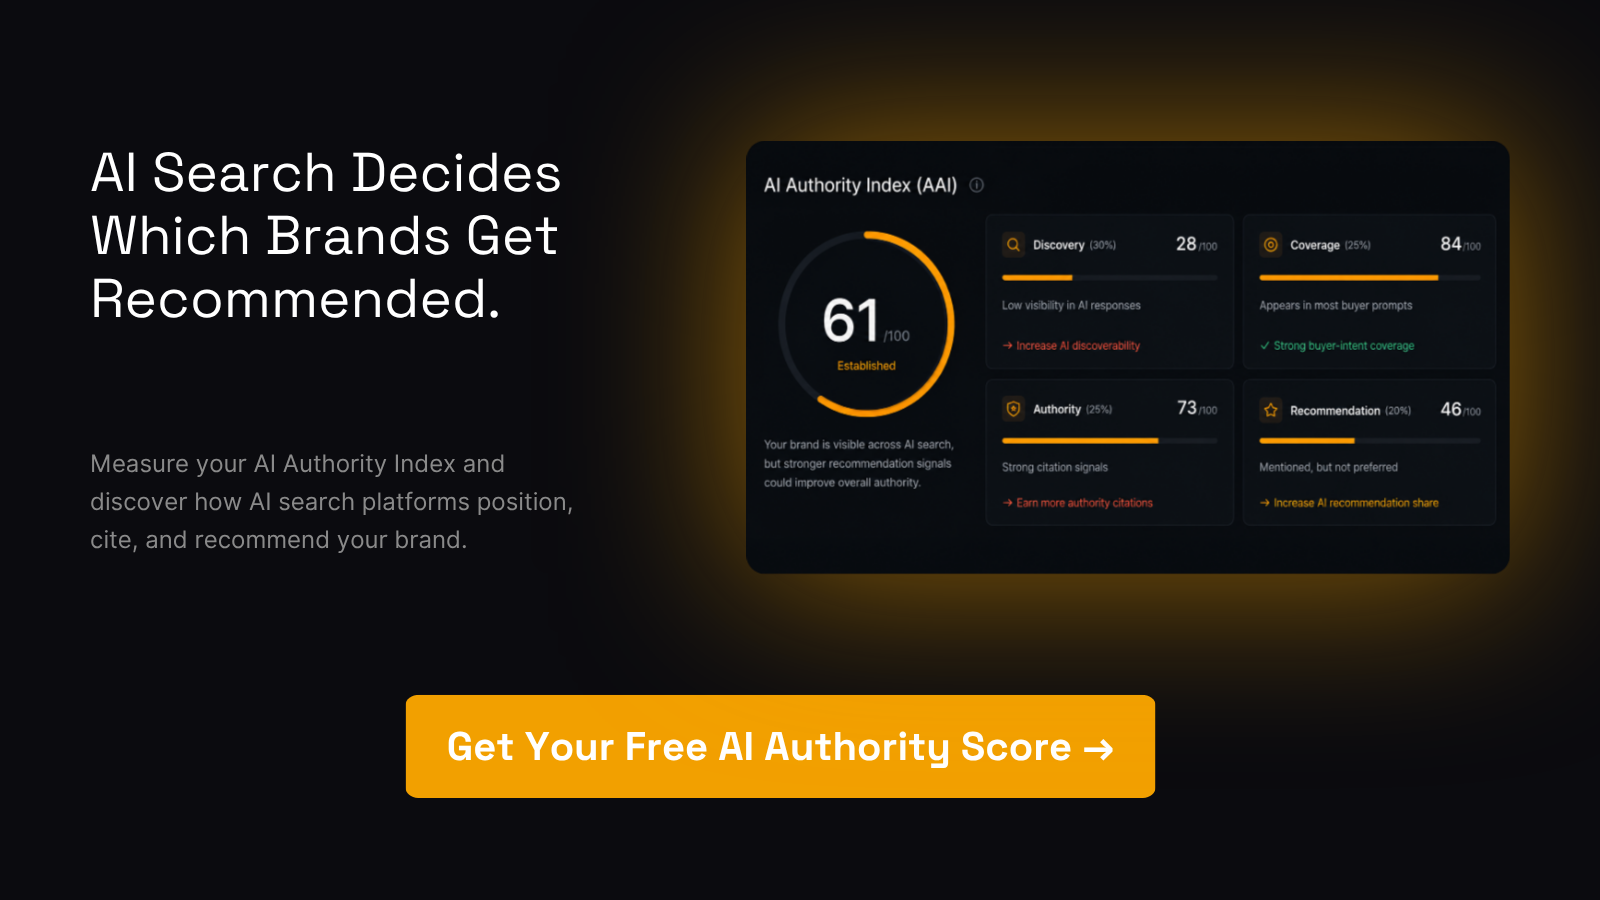
If you want a smaller first step, the Monthly AI Visibility Report gives an ongoing snapshot without a full platform rollout. Either way, the fastest way to see where your own brand's scores split by market and model is to run a Free AI Visibility Scan.
Sources
Further reading on the research behind this piece: the geographic bias study, the ChoiceEval-style brand audit, the twelve-language European study, the query language and exit IP research, and Pew Research's data on AI's presence in search. For measurement methodology, see AuthorityLayer's guide to AI visibility metrics and recommendation share.
- Large Language Models are Geographically Biased
- What web-browsing data tells us about how AI appears online
FAQ
What does AI visibility score mean?
An AI visibility score measures how often and how favorably an AI assistant like ChatGPT or Gemini names your brand when someone asks a buying-related question. It is not one number: it varies by market, language, and which assistant is asked, so a defensible score reports a range rather than a single figure.
How can you win brand visibility in AI search?
Winning visibility starts with native-language content and proof sources in each target market, not just English-language pages, since the European language study found query language changes recommendation share far more than English-only optimization alone. Consistent, high-quality mentions across multiple sources also help models treat a brand as a credible answer.
What is the best AI visibility platform for mid-market brands?
The right platform depends on how many markets and models you need to track, but the useful ones report per-market and per-model breakdowns instead of one blended number. AuthorityLayer's Growth plan and Starter plan are built for teams that need multi-model tracking without an enterprise-scale rollout.
Why should you track AI brand visibility?
AI assistants are becoming a real discovery channel: Pew Research found that 58% of search results pages carried an AI-generated summary and 93% of people visited a page mentioning AI within a month. Tracking visibility shows whether your brand is part of that answer or missing from it entirely.
How often should you re-run an AI visibility audit?
Quarterly audits catch most meaningful shifts from model updates and competitor activity, while monthly checks suit categories where visibility is actively contested. Consistent re-runs, not one-off snapshots, are what let you tell a persistent gap apart from ordinary run-to-run variance.