AI Visibility Metrics in 2026: The Practitioner's Guide
Discover essential AI visibility metrics for 2026 to improve your data analysis, enhance visibility, and boost your revenue strategies.
· 19 min read

Track Mention Rate, Citation Rate, Citation Share (Share of Voice), Hallucination Rate, Factual Inaccuracy Rate, Content Utilization Rate, and Visibility Momentum first. Those seven metrics cover the full arc from raw awareness to answer quality to trend direction. The single first action: lock a defensible query set of 100–500 prompts, with a minimum of 10 runs per prompt per engine, before you touch anything else. Without those sampling disciplines, every number you report is a moving target.
A few things determine whether your data is actually comparable over time:
- Sample size: run at least 10 queries per prompt per engine to get stable rates
- Engine segmentation: never aggregate ChatGPT, Gemini, Perplexity, and Claude into one number without disclosing the mix
- Re-baselining: log the date and scope of any model update that shifts your baseline, and flag it in every trend chart
Key Takeaways
Measuring AI visibility requires a locked query set, per-engine reporting, and explicit re-baselining disclosures — without those three disciplines, no metric in your program is reliably comparable over time.
| Point | Details |
|---|---|
| Lock your query set first | Build 100–500 prompts from real buyer language before running any baseline sampling. |
| Report per engine, never aggregated | ChatGPT, Gemini, Perplexity, and Claude behave differently; blending them hides the gaps that matter. |
| Demand re-baselining disclosures | Any trend line crossing a model update without a flag is two data series, not one trend. |
| Separate mention from citation | High Mention Rate with low Citation Rate signals an authority gap, not a visibility win. |
| Authoritylayer for decision-grade measurement | Authoritylayer delivers per-engine AI visibility monitoring, hallucination detection, and prioritized content recommendations for marketing teams. |
Table of Contents
- Why AI visibility metrics matter for discovery, attribution, and revenue
- How AI visibility metrics differ from traditional SEO metrics
- The core AI visibility metrics you need to know
- How to build a measurement program that actually holds up
- How to turn visibility data into prioritized content and product actions
- When a metric is decision-grade vs. only directional
- What to ask vendors and what drives measurement cost
- Your 30/60/90-day AI visibility program launch plan
- Common pitfalls when interpreting AI visibility data
- The measurement discipline gap most teams are not closing
- Authoritylayer gives you the measurement infrastructure to act on this
- Sources
- FAQ
Why AI visibility metrics matter for discovery, attribution, and revenue
AI-generated answers are now a primary discovery layer for buyers, and traditional analytics largely miss the influence. When ChatGPT or Gemini recommends your brand in a response, that interaction rarely shows up in Google Search Console or GA4 as a referral. The pipeline influence is real; the attribution is invisible.
The audience scale makes this urgent. Generative engine optimization (GEO) has emerged as the discipline that reframes success from SERP rank to citation and mention presence in AI answers. The IAB's Executive Summary on measuring visibility in the AI era formalizes this shift, requiring providers to disclose per-platform rates and re-baselining events so buyers can actually trust the numbers.
The downstream business consequences are concrete. A brand cited consistently in AI answers during the research phase of a purchase influences consideration before a buyer ever visits your site. Referral traffic from inline hyperlinks in AI responses does appear in analytics when the engine passes a referer header, but mention-only appearances leave no trace at all.
Pro Tip: To spot when an AI-surface mention is likely driving real pipeline, cross-reference your inline hyperlink referral traffic (filter by AI engine domains in GA4) against your CRM's first-touch attribution. A spike in direct or "unknown" traffic that correlates with a campaign period often signals untracked AI-driven discovery.
Stat to know: Inline brand hyperlink share grew significantly after early May 2026 when several major AI engines expanded citation linking, making referral-trackable AI traffic a larger share of total AI-driven visits than in earlier periods.
How AI visibility metrics differ from traditional SEO metrics
AI visibility measures presence in answers, not SERP rank or clicks. The denominators are fundamentally different, and that changes what you optimize for.
Classic SEO metrics map to AI counterparts this way:
- Rank → Average Position / Prominence: SEO rank is a single integer per keyword; AI position is a distribution across prompts, engines, and response structures with no universal slot 1
- Clicks → Citation Rate: organic clicks measure traffic delivered; Citation Rate measures how often your content is explicitly sourced in an answer, regardless of whether the user clicks through
- Impressions → Mention Rate / Answer Inclusion Rate: GSC impressions count SERP appearances; Mention Rate counts how often your brand appears in AI responses across a defined prompt set
- CTR → Inline Brand Hyperlink Share: click-through rate measures the ratio of clicks to impressions; hyperlink share measures what fraction of your AI mentions carry a clickable citation
Google Search Console and GA4 under-report AI-driven influence because most AI answer surfaces do not pass structured referral data for mention-only appearances. Inline hyperlinks, now more common after mid-2026 engine updates, do generate referral sessions, but they represent only a fraction of total AI-driven brand exposure.
Stability and reproducibility also differ. Traditional rank tracking is deterministic: the same query on the same day returns the same rank. AI responses have power-law variance. The same prompt run ten times can produce different answers, different citations, and different brand mentions. That variance is why sample size guidance recommends a minimum of 10 runs per prompt before treating any rate as directional.
The core AI visibility metrics you need to know
The table below covers every metric a serious program should track, with formulas and minimum sampling discipline. Definitions follow GEO Wiki's taxonomy and Ahrefs Brand Radar's operational definitions.
| Metric | Formula (Numerator ÷ Denominator) | What it answers | Minimum sample discipline |
|---|---|---|---|
| Mention Rate | Responses containing brand ÷ Total responses sampled | How often does the brand appear in AI answers? | 10+ runs per prompt; 100+ prompts |
| Citation Rate | Responses with explicit source citation ÷ Total responses sampled | How often is your content explicitly sourced? | 10+ runs per prompt |
| Citation Share / SOV | Brand citations ÷ Total citations across all brands | What share of citations does your brand own? | 100+ prompts; per-engine breakdown required |
| Inline Brand Hyperlink Share | Responses with brand hyperlink ÷ Total responses with any hyperlink | What fraction of hyperlinked responses include your brand? | 50+ prompts per engine |
| Content Utilization Rate | Prompts where your content is used ÷ Total prompts in set | How much of your content library is actually being drawn on? | Full prompt set; map to content inventory |
| Attribution Clarity | Responses with clear brand attribution ÷ Total brand mentions | Are mentions clearly attributed to your brand vs. generic? | Human-grade audit recommended |
| Hallucination Rate | Responses with fabricated brand claims ÷ Total responses sampled | How often does the AI invent facts about your brand? | Human-grade audit; 50+ prompts minimum |
| Factual Inaccuracy Rate | Responses with verifiable errors ÷ Total responses sampled | How often are real facts about your brand stated incorrectly? | Human-grade audit; cross-reference source of truth |
| Visibility Momentum / Citation Decay | Citation Rate (period 2) minus Citation Rate (period 1) ÷ Period 1 | Is your visibility trending up, flat, or eroding? | Consistent query set across periods; re-baseline flags required |
| Time-to-First-Citation | Distribution of prompts by how quickly brand appears in citation order | How early in the answer does your brand get cited? | Report as median, P75, P90 — never as mean |
| Co-citation Rate | Responses where brand appears alongside a named peer ÷ Total responses | Which brands does the AI associate yours with? | 100+ prompts; useful for competitive framing |
| Source Diversity Score | Unique source domains cited for brand ÷ Total brand citations | How broad is the content base driving your citations? | 50+ prompts; map to domain inventory |
| Average Position | Sum of citation-order positions ÷ Total citations | Where in the answer does your brand typically appear? | Use citation-order definition per GEO Wiki guidance |
Four metrics to implement first:
Mention Rate = Brand mentions ÷ Total responses. Your awareness baseline. Start here.
Citation Rate = Explicit citations ÷ Total responses. Separates awareness from authority. A brand can be mentioned frequently without ever being cited — tracking both clarifies the gap.
Citation Share (SOV) = Your citations ÷ All citations in prompt set. The competitive number. Impression-weight it by engine if engines have different audience sizes.
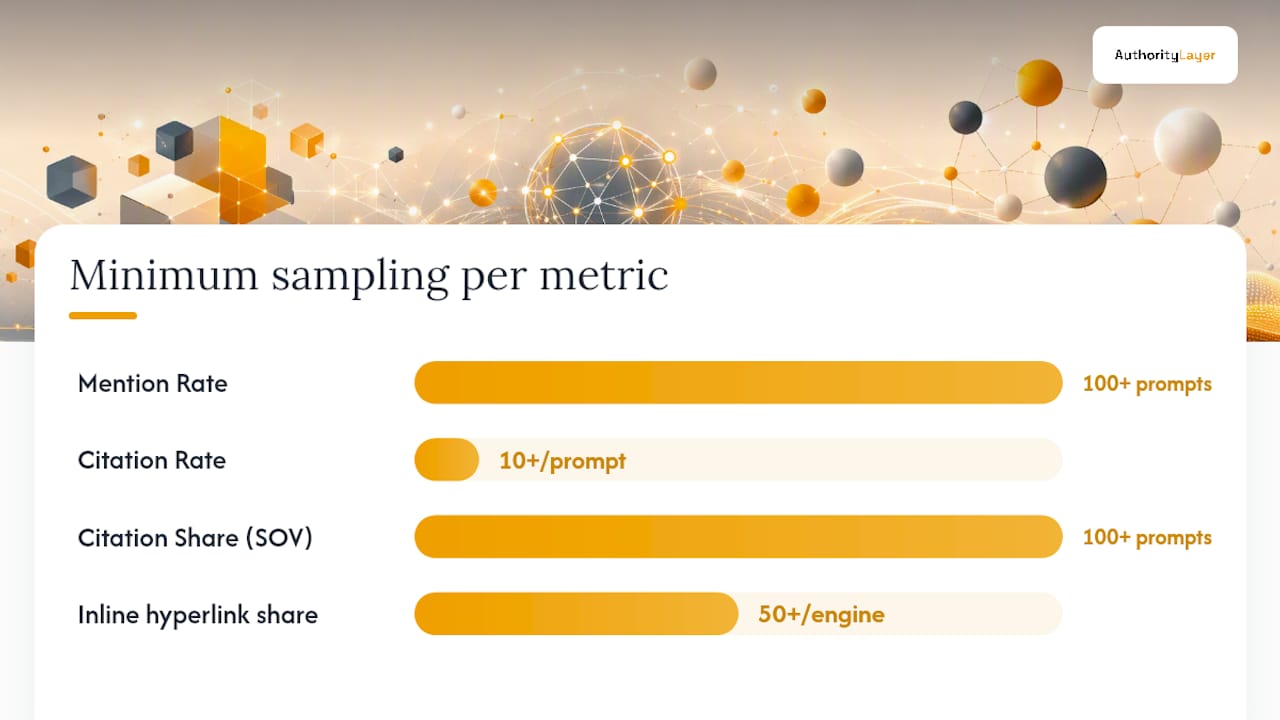
Hallucination Rate = Fabricated claims ÷ Total responses. The risk metric. High hallucination rates damage brand trust even when overall visibility looks strong.
Common vendor pitfalls to watch:
- Composite "visibility scores" often blend Mention Rate, Citation Rate, and sentiment into a single index without disclosing the formula. Always request the component breakdown.
- Engine aggregation hides per-platform variance. ChatGPT and Perplexity can show dramatically different Citation Rates for the same brand on the same prompt set.
- Query set opacity: if a vendor won't share the prompt list or methodology, their trend data is not comparable across reporting periods.
- Time-to-First-Citation reported as a mean is misleading because the distribution is skewed. Insist on median, P75, and P90.
How to build a measurement program that actually holds up
Lock a defensible query set and report per engine with confidence intervals. Aggregating across engines without disclosure is one of the most common ways measurement programs produce numbers that look clean but mean nothing.
Building your query set (100–500 prompts for most programs):
- Pull from organic keyword data, sales call transcripts, and support tickets to capture real buyer language
- Categorize prompts into four types: definitional ("what is [category]"), buyer-intent ("best [product type] for [use case]"), implementation ("how to [task]"), and comparison ("X vs. Y")
- Include prompts where you expect to appear and prompts where you currently do not — the gaps are where the opportunity lives
- Lock the set for at least one quarter before refreshing; mid-period changes break trend comparability
- Document every prompt, its category, and the date it was added or retired
Sampling and cadence rules:
- Run each prompt at least 10 times per engine per sampling period to get stable rates, per published sample-size guidance
- Handle prompt fanout (one prompt generating multiple sub-queries) by logging each sub-query separately and weighting by impression share when calculating SOV
- For impression-weighted SOV, weight each engine by its relative audience share in your target market
- Weekly snapshots for Mention Rate and Citation Rate; monthly trend reviews with human-grade audit for Hallucination Rate and Factual Inaccuracy Rate; quarterly query set refresh
Platform coverage: report ChatGPT, Gemini (including AI Overviews and AI Mode), Perplexity, and Claude as separate rows, never combined. Each engine has its own citation behavior, source preferences, and update cadence.
Re-baselining after model updates: when a major model update shifts your baseline materially, log the update date, flag the discontinuity in every trend chart, and monitor for data quality shifts before drawing conclusions. Demand the same disclosure from any vendor you work with. A trend line that crosses a model update without a flag is not a trend line — it is two separate data series stitched together.
How to turn visibility data into prioritized content and product actions
Metric gaps translate into three action types: content extraction and structure, authority signal building, and product or data corrections. Prioritize by effort versus impact, not by which metric looks worst.
First 30 days:
- Run your baseline sampling across all four engines with your locked query set
- Identify the top 10 prompts where Mention Rate is high but Citation Rate is low — those are your highest-leverage content targets
- For each gap prompt, audit whether your content contains a clear, extractable factual claim the AI can cite. If it does not, add a structured summary paragraph with a specific, verifiable fact
- Flag every prompt with a Hallucination Rate above your threshold for immediate content correction and canonical fact publishing
Days 31–60:
- Implement schema markup (FAQ, HowTo, Article) on pages that appear in gap prompts
- Build a citation-optimized paragraph for each high-priority topic: one clear claim, one supporting fact, one source reference, under 100 words
- Push authoritative content to the domains your Source Diversity Score shows are underrepresented
- Set up weekly snapshot reporting and share per-engine Citation Share with your stakeholders
Effort vs. impact guidance:
- Low effort, high impact: adding extractable summary sentences to existing high-traffic pages; publishing canonical fact sheets for your product or brand
- Medium effort, high impact: structured data implementation; building topic clusters around high-gap prompts
- High effort, variable impact: earning new referring domains; third-party review and mention campaigns
Prompt pack tips:
- Write citation-optimized paragraphs with a single declarative claim in the first sentence
- Include a specific figure, date, or named standard where possible — AI engines favor citable specifics
- Use structured data to signal the type of content (definition, comparison, how-to) so engines can match it to the right prompt category
- Test each paragraph by running the corresponding prompt and checking whether the new content appears in citations within two to three sampling cycles
When a metric is decision-grade vs. only directional
Not every metric is decision-grade. The IAB's framework for measuring visibility in the AI era separates directional intelligence from decision-grade measurement, and the distinction matters when you are allocating budget or reporting to a board.
A metric is directional when it gives you a signal worth monitoring but lacks the sample size, reproducibility, or methodology transparency to drive a major budget decision. A metric is decision-grade when it meets disclosure standards, has sufficient sample size, is reproducible across runs, and comes with per-platform breakdowns.
Disclosure checklist for vendor reports:
- Per-platform rates reported separately (not aggregated)
- Re-baselining events disclosed with date and scope
- Hallucination detection method described (automated, human-grade, or hybrid)
- Sample discipline stated (runs per prompt, prompt set size, sampling cadence)
- Confidence intervals or variance ranges included for key rates
- Query set available for review or at minimum categorized by prompt type
- Composite indices broken into component metrics with formulas
The IAB framework also flags that metrics requiring methodological judgment, such as prominence, sentiment, and framing, carry higher variance and should only be treated as decision-grade when vendors disclose reproducibility standards and human-grade verification steps.
Pro Tip: When issuing an RFP for an AI visibility measurement vendor, add a single contract clause: "Provider will disclose the date and scope of any re-baselining event within 5 business days and flag affected trend data in all reports." Vendors who push back on that clause are telling you something important about how they handle model updates.
For reproducibility, ask vendors whether they can provide raw data exports. If a vendor can only deliver a dashboard with no export, you cannot independently verify the numbers or reprocess them after a methodology change.
What to ask vendors and what drives measurement cost
Prioritize methodology transparency, engine coverage, reproducibility, and raw data access. Those four criteria separate a measurement program you can trust from one that looks good in a slide deck.
Questions to ask in a vendor selection call:
- What is your runs-per-prompt minimum, and how do you handle variance across runs?
- Which engines do you cover, and do you report per-engine or aggregate?
- How do you detect hallucinations and factual inaccuracies — automated, human-grade, or hybrid?
- What is your re-baselining policy when a major model update occurs?
- Can you export raw prompt-level data, or is reporting dashboard-only?
- How is your query set constructed, and can we review or customize it?
- How do you calculate Share of Voice — impression-weighted or raw citation count?
Pricing drivers (see Authoritylayer's pricing for a concrete example of how these translate to plan tiers):
- Prompt set scale: more prompts mean more compute and more runs
- Runs per prompt: higher sample sizes cost more but produce more reliable rates
- Engine coverage: each additional engine adds sampling cost
- Reporting cadence: weekly snapshots cost more than monthly
- Human-grade audits: the most expensive line item, but required for Hallucination Rate and Factual Inaccuracy Rate to be decision-grade
Red flags:
- Vendor refuses to share the query set or methodology documentation
- Reports aggregate across engines with no per-platform breakdown
- No disclosure of re-baselining events in trend data
- Composite "visibility score" with no formula breakdown
- No raw data export option
If you are unsure whether your current measurement approach is tracking the right things, this perspective on common AI measurement mistakes is worth reading before you commit to a vendor or build internally.
Your 30/60/90-day AI visibility program launch plan
Days 1–30: Foundation
- Assemble your query set (100–500 prompts) from organic keywords, sales transcripts, and support tickets
- Categorize prompts by type: definitional, buyer-intent, implementation, comparison
- Run baseline sampling across ChatGPT, Gemini, Perplexity, and Claude — minimum 10 runs per prompt per engine
- Document your baseline Mention Rate, Citation Rate, and Citation Share per engine
- Run a human-grade audit on a 50-prompt sample to establish baseline Hallucination Rate and Factual Inaccuracy Rate
Days 31–60: Activation
- Implement the top 10 content fixes identified from your gap analysis
- Add structured data (FAQ, HowTo, Article schema) to high-priority pages
- Set up weekly snapshot reporting with per-engine breakdowns
- Share Citation Share and Mention Rate dashboards with SEO, content, and product teams
- Identify co-citation patterns and flag any brand associations you want to shift
Days 61–90: Optimization and governance
- Run a second human-grade audit to measure Hallucination Rate change after content fixes
- Review Visibility Momentum across engines — flag any engine where Citation Decay is accelerating
- Refresh the bottom 20% of your query set based on new keyword and sales data
- Document your re-baselining policy and share it with stakeholders
- Present a 90-day trend report with per-engine results, confidence intervals, and a prioritized action list for the next quarter
Role assignments:
- SEO: owns query set design, Citation Share tracking, and schema implementation
- Content: owns citation-optimized paragraph creation and content gap remediation
- Product/data: owns Hallucination Rate response and canonical fact publishing
- Analytics: owns reporting cadence, data export, and integration with existing SEO and marketing analytics pipelines
Common pitfalls when interpreting AI visibility data
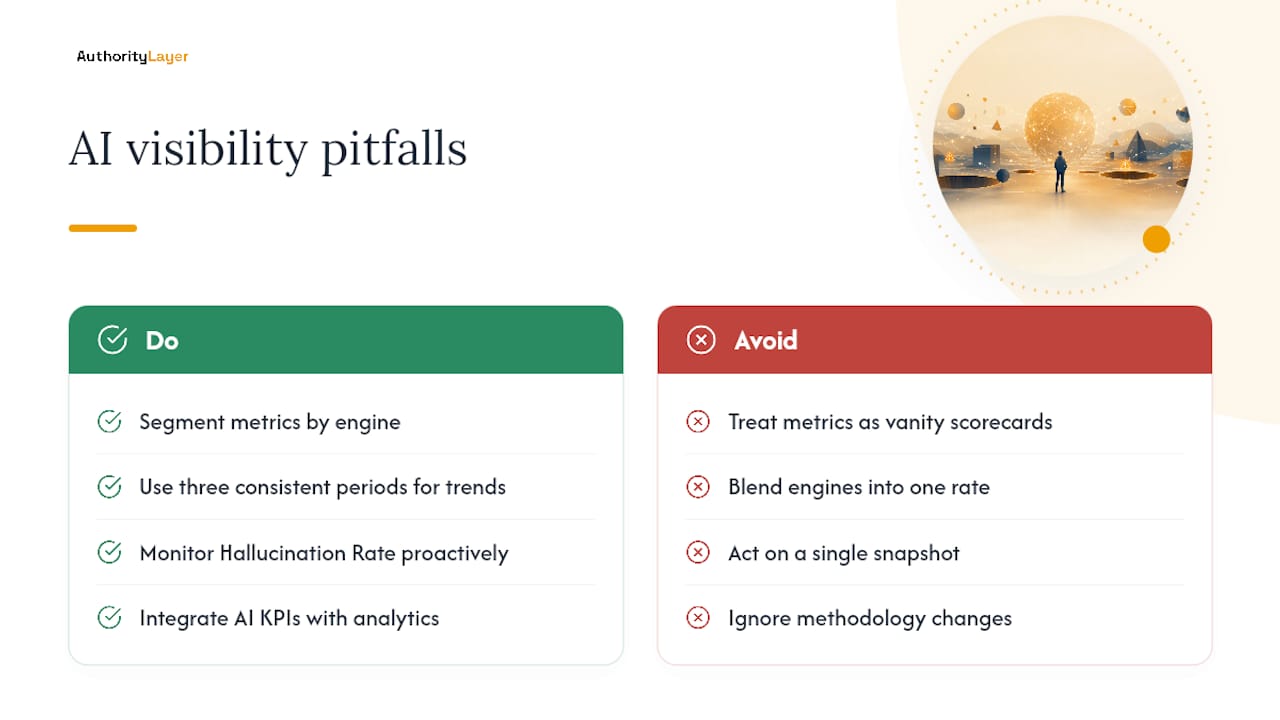
The biggest strategic mistake is treating AI visibility metrics as a vanity scorecard rather than a diagnostic tool. High Mention Rate with low Citation Rate means the AI knows your brand exists but does not trust your content enough to source it. That is an authority gap, not a visibility win.
Pitfall 1: Comparing numbers across engines without segmentation. Perplexity cites sources far more aggressively than ChatGPT in conversational mode. A blended Citation Rate that mixes the two will always look better than your actual ChatGPT-only rate, which is often the engine your buyers use most.
Pitfall 2: Treating a single snapshot as a trend. AI response behavior has meaningful run-to-run variance. One sampling period is a data point. Three consecutive periods with consistent methodology is a trend. Four or more is something you can act on with confidence.
Pitfall 3: Ignoring Hallucination Rate until it becomes a crisis. Brands that monitor Hallucination Rate proactively catch incorrect pricing, discontinued products, and fabricated feature claims before they reach buyers at scale. Brands that do not monitor it often discover the problem through a sales call gone wrong.
Pitfall 4: Optimizing for the metric, not the outcome. Citation Rate can be gamed by publishing highly citable but low-value content. The goal is to be cited on the prompts that matter to buyers, not to maximize citations across all prompts indiscriminately. Segment your Citation Share by prompt category and weight buyer-intent prompts more heavily in your reporting.
Pitfall 5: Skipping integration with existing analytics. AI visibility KPIs should feed into the same reporting stack as your organic search and paid media metrics. When AI Citation Share rises and direct traffic rises in the same period, you have a correlation worth investigating. When they diverge, you have a measurement gap worth closing.
The GEO Compass measurement guide flags methodology drift as one of the most common failure modes in AI visibility programs: teams change their query set, switch engines, or adjust sampling cadence mid-period without flagging the change, then report a trend that is actually a methodology artifact.
The measurement discipline gap most teams are not closing
The market has moved fast enough that most marketing teams now know they should be tracking AI visibility. The gap is not awareness — it is discipline. What the team at Authoritylayer sees most often when auditing AI visibility programs is not a lack of data. It is an excess of undisciplined data: mention counts pulled from a single engine on a single day, composite scores with no formula, trend lines that cross model updates without a flag.
The teams that get real value from this measurement are the ones that treat it the way they treat paid media attribution: with a defined methodology, a locked measurement period, and a clear separation between what is directional and what is decision-grade. A brand that discovers its Hallucination Rate on ChatGPT is materially higher than on Perplexity has a specific, fixable problem. A brand that only tracks a blended "AI visibility score" has a number that feels reassuring and tells them almost nothing.
The other pattern worth naming: teams that improve their Citation Rate on definitional prompts while ignoring buyer-intent prompts. The AI knowing your brand in a category context is useful. The AI recommending your brand when a buyer asks "what should I use for X" is where the pipeline actually comes from. Weight your prompt set accordingly, and segment your reporting to reflect it.
Authoritylayer gives you the measurement infrastructure to act on this
Most teams tracking AI visibility are doing it with spreadsheets, manual prompt runs, and a vendor dashboard that aggregates across engines. The result is data that looks complete but cannot answer the questions that actually drive decisions: which engine is underperforming, which content is being hallucinated, and which prompt categories are driving real buyer-intent citations.
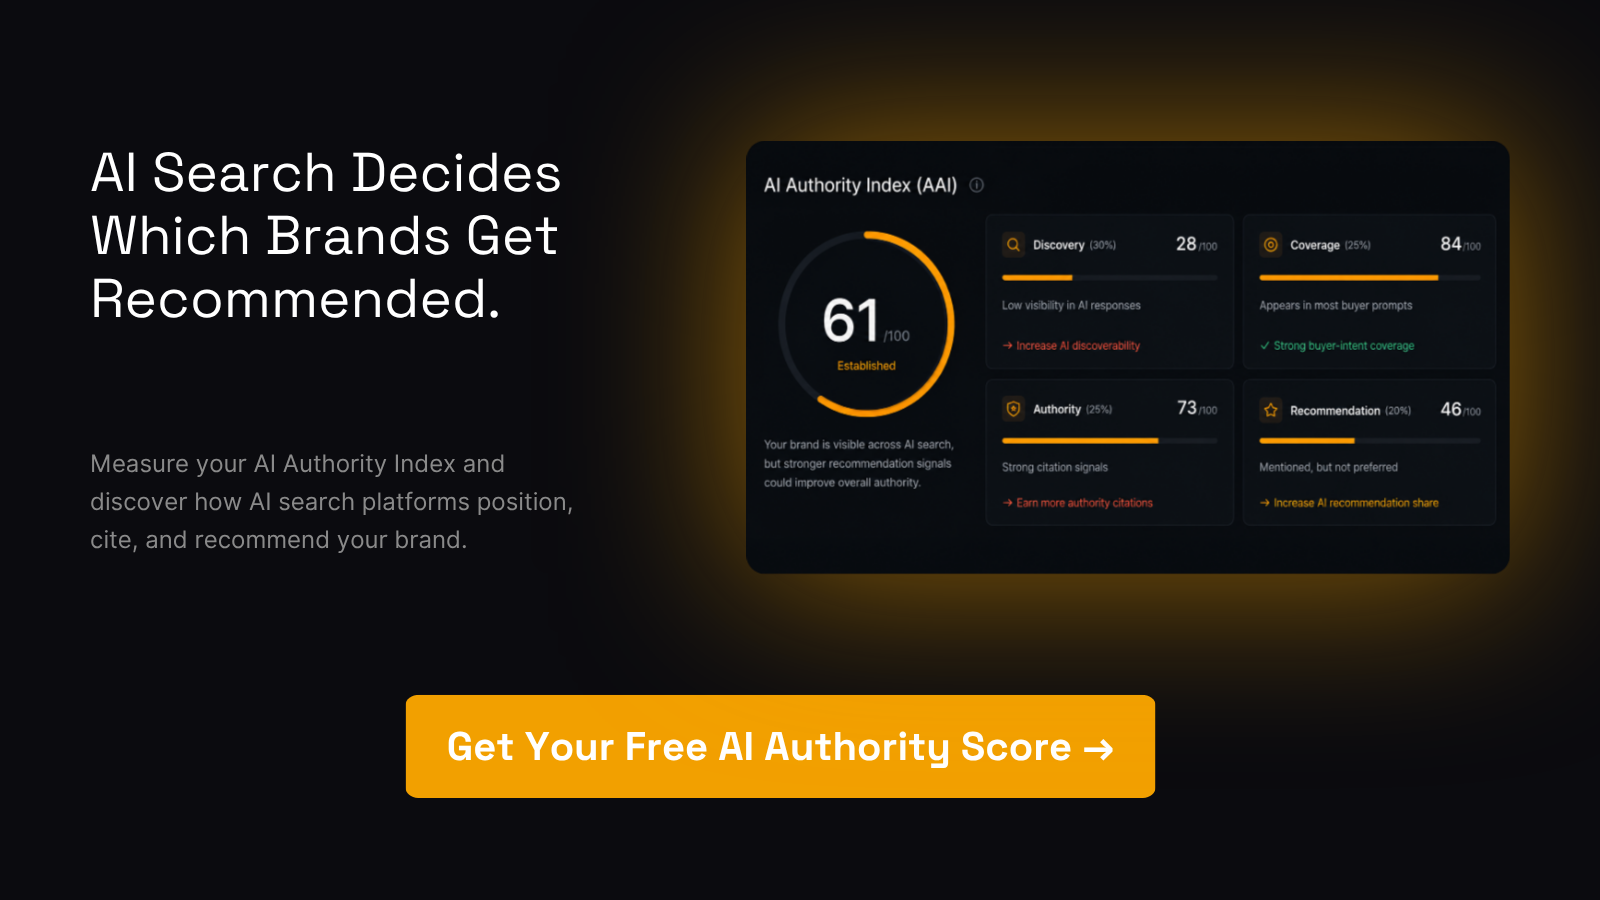
Authoritylayer is built for exactly the measurement standard this article describes. Per-engine reporting across ChatGPT, Gemini, Perplexity, and Claude. Hallucination detection with disclosed methodology. Re-baselining flags in every trend report. Prioritized content recommendations tied to your specific prompt gaps, not generic best practices.
- Per-engine Citation Share and Mention Rate reported separately, with confidence intervals and raw data export
- Hallucination Rate and Factual Inaccuracy Rate tracked with human-grade audit options for decision-grade accuracy
Run a free AI visibility scan to get your baseline Mention Rate and Citation Share across the major AI engines in under 24 hours. Or explore how Authoritylayer works to see the full measurement methodology before you commit.
Sources
- Executive Summary
- What is generative engine optimization
- AI Visibility Metrics
- GEO Metrics · GEO Wiki
- AI Visibility Metrics: Formulas, Benchmarks & Sample Sizes (2026)
- Monitoring AI Data Quality in Production: 2026 Guide
FAQ
What are the most important AI visibility metrics to track?
Mention Rate, Citation Rate, and Citation Share (Share of Voice) are the three to start with. Add Hallucination Rate and Factual Inaccuracy Rate once your baseline sampling is stable.
How is Citation Rate different from Mention Rate?
Mention Rate counts how often your brand appears in an AI response; Citation Rate counts how often your content is explicitly sourced. A brand can have high Mention Rate and low Citation Rate, which signals awareness without authority.
How many prompts do I need for reliable AI visibility measurement?
A query set of 100–500 prompts with at least 10 runs per prompt per engine produces directional data. Human-grade audits on a 50-prompt sample are required for Hallucination Rate and Factual Inaccuracy Rate to reach decision-grade status. These minimum sampling disciplines should be applied when building your baseline and running your measurement program.
What should I demand from an AI visibility measurement vendor?
Per-platform rates reported separately, re-baselining disclosures with dates, hallucination detection methodology, sample discipline documentation, and raw data export capability. Vendors who aggregate across engines without breakdown or refuse to share query set details are not providing decision-grade measurement.
How does Authoritylayer handle re-baselining after model updates?
Authoritylayer flags re-baselining events in trend reports with the date and scope of the model update, so trend lines are never silently stitched across a methodology discontinuity. Full methodology details are available at Authoritylayer.
Recommended
- Best AI Visibility Tools for Marketing Teams in 2026 | AuthorityLayer Insights
- AI Search Strategy: A CMO Playbook for 2026 | AuthorityLayer Insights
- AI Competitive Intelligence: What Actually Moves Recommendation Share | AuthorityLayer Insights
- Insights — AI Visibility Intelligence Reports | AuthorityLayer